
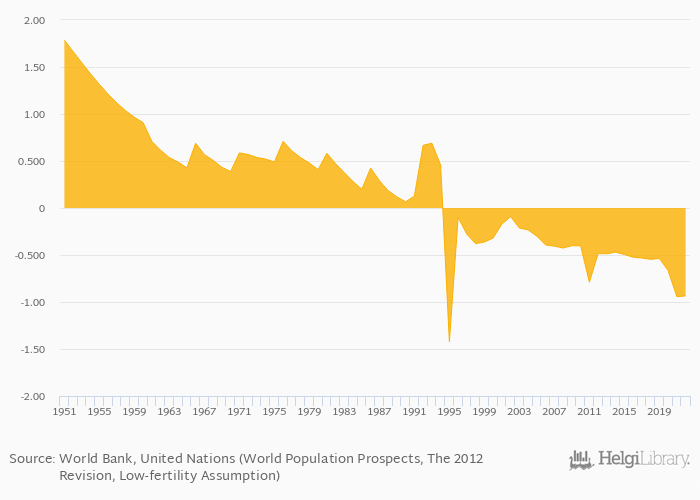
Population growth rate rose 0.902% to -0.935% in Serbia in 2022, according to the National Statistical Office.
Historically, population growth rate in Serbia reached an all time high of 1.79% in 1951 and an all time low of -1.42% in 1995. When compared to Serbia's main peers, population growth rate in Bosnia and Herzegovina amounted to -0.545%, -0.680% in Croatia, -0.577% in Hungary and -0.729% in Romania in 2022.
Serbia has been ranked 174th within the group of 178 countries we follow in terms of population growth rate, 6 places below the position seen 10 years ago.
| Population Growth Rate | Unit | 2030 | 2031 | 2032 | 2033 | 2034 | 2035 | 2036 | 2037 | 2038 | 2039 | 2040 | 2041 | 2042 | 2043 | 2044 | 2045 | 2046 | 2047 | 2048 | 2049 | 2050 |
| Austria | % | -0.202% | -0.218% | -0.234% | -0.251% | -0.270% | ||||||||||||||||
| Bosnia and Herzegovina | % | -1.06% | -1.08% | -1.11% | -1.13% | -1.16% | ||||||||||||||||
| Bulgaria | % | -1.52% | -1.55% | -1.57% | -1.60% | -1.62% | ||||||||||||||||
| Croatia | % | -1.03% | -1.06% | -1.08% | -1.10% | -1.12% | ||||||||||||||||
| Czechia | % | -0.316% | -0.324% | -0.333% | -0.343% | -0.357% | ||||||||||||||||
| Hungary | % | -0.735% | -0.744% | -0.753% | -0.763% | -0.775% | ||||||||||||||||
| Italy | % | -0.482% | -0.503% | -0.526% | -0.549% | -0.574% | ||||||||||||||||
| Moldova | % | -1.72% | -1.77% | -1.84% | -1.90% | -1.92% | ||||||||||||||||
| Montenegro | % | -0.983% | -1.01% | -1.04% | -1.06% | -1.09% | ||||||||||||||||
| Poland | % | -0.950% | -0.971% | -0.991% | -1.01% | -1.03% | ||||||||||||||||
| Romania | % | -1.15% | -1.18% | -1.21% | -1.24% | -1.26% | ||||||||||||||||
| Serbia | % | -1.56% | -1.60% | -1.64% | -1.68% | -1.71% | ||||||||||||||||
| Slovakia | % | -0.862% | -0.881% | -0.901% | -0.921% | -0.942% | ||||||||||||||||
| Slovenia | % | -0.582% | -0.603% | -0.624% | -0.646% | -0.668% | ||||||||||||||||
| Ukraine | % | -1.39% | -1.42% | -1.44% | -1.46% | -1.48% |
 Helgi Library


