
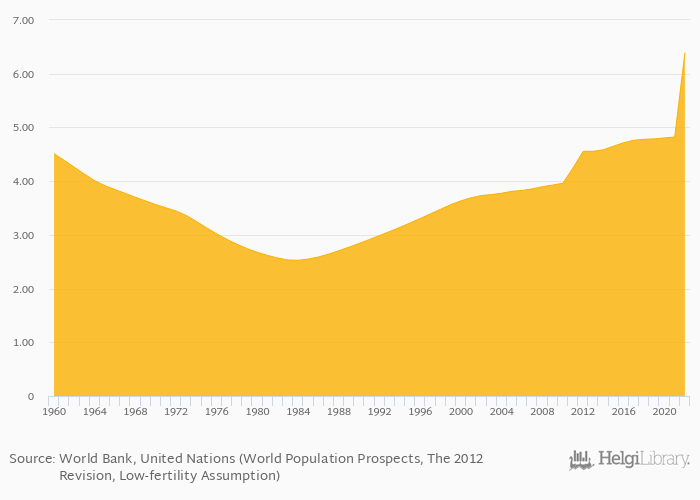
Population over 65 years old as a percentage of total population rose 32.5% to 6.39% in Libya in 2022, according to the National Statistical Office.
Historically, population over 65 years old as a percentage of total population in Libya reached an all time high of 6.39% in 2022 and an all time low of 2.53% in 1984. When compared to Libya's main peers, population over 65 years old as a percentage of total population in Algeria amounted to 6.15%, 2.47% in Chad, 6.83% in Egypt and 10.2% in Tunisia in 2022.
Libya has been ranked 98th within the group of 174 countries we follow in terms of population over 65 years old as a percentage of total population, 5 places above the position seen 10 years ago.
| Population Over 65 Years Old (As % of Total Population) | Unit | 2030 | 2031 | 2032 | 2033 | 2034 | 2035 | 2036 | 2037 | 2038 | 2039 | 2040 | 2041 | 2042 | 2043 | 2044 | 2045 | 2046 | 2047 | 2048 | 2049 | 2050 |
| Algeria | % | 13.0% | 13.5% | 14.0% | 14.6% | 15.2% | ||||||||||||||||
| Cameroon | % | 4.84% | 4.97% | 5.15% | 5.33% | 5.51% | ||||||||||||||||
| Chad | % | 3.33% | 3.41% | 3.52% | 3.63% | 3.73% | ||||||||||||||||
| Egypt | % | 11.5% | 11.8% | 12.3% | 12.8% | 13.3% | ||||||||||||||||
| Israel | % | 18.6% | 18.9% | 19.1% | 19.4% | 19.6% | ||||||||||||||||
| Italy | % | 35.7% | 36.1% | 36.3% | 36.5% | 36.7% | ||||||||||||||||
| Libya | % | 17.0% | 17.7% | 18.4% | 19.2% | 20.0% | ||||||||||||||||
| Malta | % | 30.3% | 30.7% | 31.2% | 31.7% | 32.3% | ||||||||||||||||
| Morocco | % | 14.8% | 15.1% | 15.6% | 16.1% | 16.6% | ||||||||||||||||
| Niger | % | 2.71% | 2.72% | 2.73% | 2.74% | 2.75% | ||||||||||||||||
| Nigeria | % | 3.70% | 3.78% | 3.86% | 3.94% | 4.03% | ||||||||||||||||
| Saudi Arabia | % | 16.1% | 16.8% | 17.6% | 18.3% | 19.1% | ||||||||||||||||
| Spain | % | 35.5% | 36.3% | 36.8% | 37.3% | 37.7% | ||||||||||||||||
| Sudan | % | 5.90% | 6.04% | 6.19% | 6.34% | 6.48% | ||||||||||||||||
| Tunisia | % | 21.9% | 22.6% | 23.3% | 24.1% | 24.8% |
 Helgi Library


