
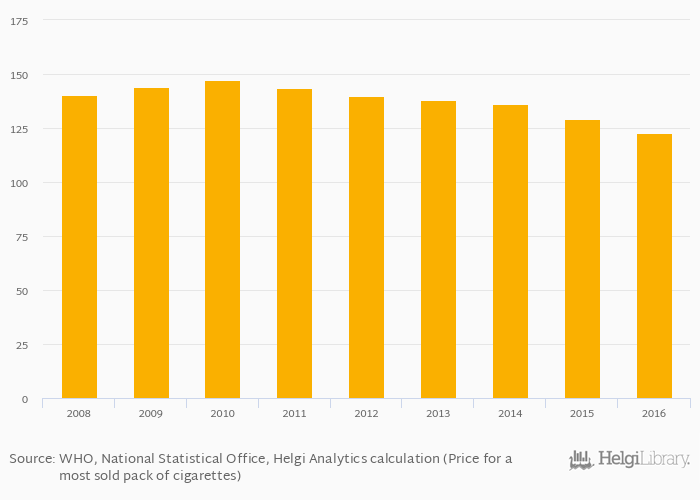
Price of cigarettes as a percentage of average U.S. price fell 5.16% to 123% in Canada in 2016, according to the National Statistical Office.
Historically, price of cigarettes as a percentage of average U.S. price in Canada reached an all time high of 147% in 2010 and an all time low of 123% in 2016. When compared to Canada's main peers, price of cigarettes as a percentage of average U.S. price in Australia amounted to 246%, 39.0% in Mexico, 170% in United Kingdom and 100% in USA in 2016.
Canada has been ranked 12th within the group of 165 countries we follow in terms of price of cigarettes as a percentage of average U.S. price.
| Price of Cigarettes (As % of Average U.S. Price) | Unit | 1996 | 1997 | 1998 | 1999 | 2000 | 2001 | 2002 | 2003 | 2004 | 2005 | 2006 | 2007 | 2008 | 2009 | 2010 | 2011 | 2012 | 2013 | 2014 | 2015 | 2016 |
| Australia | % | 188% | 213% | 236% | 246% | 255% | ||||||||||||||||
| Belgium | % | ... | ... | ... | ... | ... | ... | ... | ... | ... | ... | ... | ... | 110% | 109% | 107% | 116% | 124% | ||||
| Belize | % | ... | ... | ... | ... | ... | ... | ... | ... | ... | ... | ... | ... | 43.7% | 42.4% | 41.2% | 40.7% | 40.1% | ||||
| Canada | % | ... | ... | ... | ... | ... | ... | ... | ... | ... | ... | ... | ... | 147% | 144% | 140% | 138% | 136% | ||||
| China | % | ... | ... | ... | ... | ... | ... | ... | ... | ... | ... | ... | ... | 12.9% | 19.7% | 26.0% | 26.0% | 26.0% | ||||
| France | % | ... | ... | ... | ... | ... | ... | ... | ... | ... | ... | ... | ... | 128% | 127% | 126% | 138% | 150% | ||||
| Germany | % | ... | ... | ... | ... | ... | ... | ... | ... | ... | ... | ... | ... | 113% | 110% | 107% | 112% | 117% | ||||
| Guatemala | % | ... | ... | ... | ... | ... | ... | ... | ... | ... | ... | ... | ... | 29.7% | 29.6% | 29.5% | 31.2% | 32.9% | ||||
| Honduras | % | ... | ... | ... | ... | ... | ... | ... | ... | ... | ... | ... | ... | 25.0% | 27.1% | 29.0% | 28.3% | 27.6% | ||||
| Indonesia | % | ... | ... | ... | ... | ... | ... | ... | ... | ... | ... | ... | ... | 25.7% | 27.4% | 29.0% | 27.2% | 25.4% | ||||
| Ireland | % | ... | ... | ... | ... | ... | ... | ... | ... | ... | ... | ... | ... | 195% | 190% | 185% | 196% | 206% | ||||
| Japan | % | ... | ... | ... | ... | ... | ... | ... | ... | ... | ... | ... | ... | 60.7% | 74.0% | 86.5% | 76.7% | 67.1% | ||||
| Malaysia | % | ... | ... | ... | ... | ... | ... | ... | ... | ... | ... | ... | ... | 54.9% | 53.6% | 52.4% | 56.4% | 60.4% | ||||
| Mexico | % | ... | ... | ... | ... | ... | ... | ... | ... | ... | ... | ... | ... | 41.4% | 45.6% | 49.6% | 52.5% | 55.4% | ||||
| New Zealand | % | ... | ... | ... | ... | ... | ... | ... | ... | ... | ... | ... | ... | 127% | 161% | 193% | 212% | 232% | ||||
| Papua New Guinea | % | ... | ... | ... | ... | ... | ... | ... | ... | ... | ... | ... | ... | 87.4% | 102% | 119% | 112% | 105% | ||||
| USA | % | 100% | 100% | 100% | 100% | 100% | ||||||||||||||||
| United Kingdom | % | 171% | 171% | 170% | 187% | 204% |
 Helgi Library


