
Follow us for the latest automotive news.
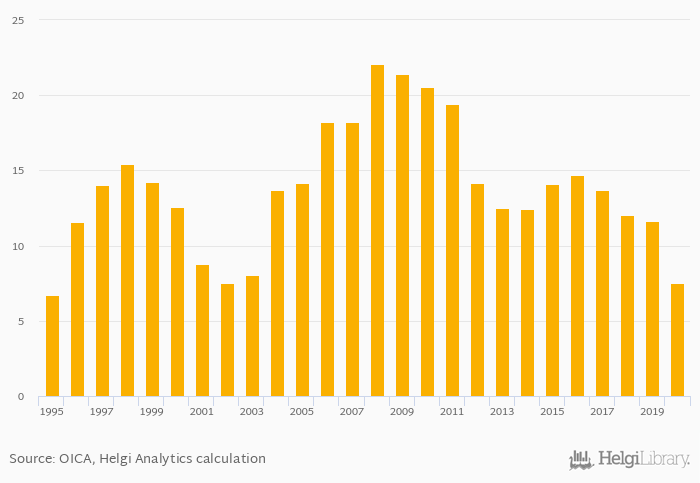
Production of cars per 1,000 people fell 35.6% to 7.49 vehicles in Poland in 2020, according to ACEA.
Historically, production of cars per 1,000 people in Poland reached an all time high of 22.0 vehicles in 2008 and an all time low of 6.73 vehicles in 1995. When compared to Poland's main peers, production of cars per 1,000 people in Czech Republic amounted to 108 vehicles, 43.8 vehicles in Germany, 9.22 vehicles in Russia and 0.100 vehicles in Ukraine in 2020.
Poland has been ranked 30th within the group of 50 countries we follow in terms of production of cars per 1,000 people, 19 places below the position seen 10 years ago.
| Production of Cars Per 1,000 People | Unit | 2000 | 2001 | 2002 | 2003 | 2004 | 2005 | 2006 | 2007 | 2008 | 2009 | 2010 | 2011 | 2012 | 2013 | 2014 | 2015 | 2016 | 2017 | 2018 | 2019 | 2020 |
| Austria | vehicles | 16.0 | 12.3 | 10.7 | 9.52 | 17.0 | ||||||||||||||||
| Belgium | vehicles | 43.5 | 33.3 | 31.9 | 30.2 | 23.9 | ||||||||||||||||
| China | vehicles | 14.4 | 15.2 | 17.5 | 17.8 | 16.8 | ||||||||||||||||
| Czechia | vehicles | 117 | 116 | 126 | 132 | 134 | ||||||||||||||||
| France | vehicles | 23.3 | 24.1 | 25.3 | 27.0 | 27.3 | ||||||||||||||||
| Germany | vehicles | 68.2 | 69.7 | 70.4 | 69.4 | 63.2 | ||||||||||||||||
| Hungary | vehicles | 22.8 | 50.1 | 53.5 | 51.6 | 47.8 | ||||||||||||||||
| Japan | vehicles | 65.5 | 62.2 | 62.8 | 66.8 | 67.2 | ||||||||||||||||
| Poland | vehicles | 12.5 | 14.1 | 14.7 | 13.7 | 12.0 | ||||||||||||||||
| Romania | vehicles | 18.2 | 18.1 | 16.9 | 17.0 | 22.7 | ||||||||||||||||
| Russia | vehicles | 11.9 | 8.64 | 8.03 | 9.68 | 11.3 | ||||||||||||||||
| Slovakia | vehicles | 183 | 192 | 193 | 186 | 204 | ||||||||||||||||
| USA | vehicles | 13.3 | 12.9 | 12.1 | 9.30 | 8.50 | ||||||||||||||||
| Ukraine | vehicles | 0.581 | 0.128 | 0.099 | 0.168 | 0.132 |
 Helgi Library


