
Follow us for the latest automotive news.
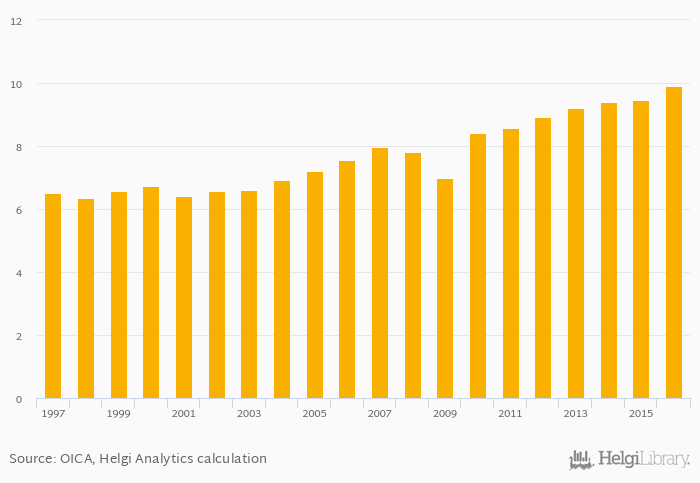
Production of cars per 1,000 people rose 4.61% to 9.89 vehicles in the World in 2016, according to ACEA.
Historically, production of cars per 1,000 people in the World reached an all time high of 9.89 vehicles in 2016 and an all time low of 6.35 vehicles in 1998. When compared to World's main peers, production of cars per 1,000 people in China amounted to 17.5 vehicles, 70.4 vehicles in Germany, 62.8 vehicles in Japan and 12.1 vehicles in USA in 2016.
World has been ranked th within the group of 49 countries we follow in terms of production of cars per 1,000 people.
| Production of Cars Per 1,000 People | Unit | 2000 | 2001 | 2002 | 2003 | 2004 | 2005 | 2006 | 2007 | 2008 | 2009 | 2010 | 2011 | 2012 | 2013 | 2014 | 2015 | 2016 | 2017 | 2018 | 2019 | 2020 |
| Austria | vehicles | 16.0 | 12.3 | 10.7 | 9.52 | 17.0 | ||||||||||||||||
| Belgium | vehicles | 43.5 | 33.3 | 31.9 | 30.2 | 23.9 | ||||||||||||||||
| Canada | vehicles | 25.9 | 25.0 | 22.4 | 20.8 | 18.0 | ||||||||||||||||
| China | vehicles | 14.4 | 15.2 | 17.5 | 17.8 | 16.8 | ||||||||||||||||
| France | vehicles | 23.3 | 24.1 | 25.3 | 27.0 | 27.3 | ||||||||||||||||
| Germany | vehicles | 68.2 | 69.7 | 70.4 | 69.4 | 63.2 | ||||||||||||||||
| India | vehicles | 2.51 | 2.68 | 2.89 | 3.06 | 3.10 | ||||||||||||||||
| Japan | vehicles | 65.5 | 62.2 | 62.8 | 66.8 | 67.2 | ||||||||||||||||
| Mexico | vehicles | 15.6 | 15.9 | 15.9 | 15.1 | 12.5 | ||||||||||||||||
| Poland | vehicles | 12.5 | 14.1 | 14.7 | 13.7 | 12.0 | ||||||||||||||||
| Russia | vehicles | 11.9 | 8.64 | 8.03 | 9.68 | 11.3 | ||||||||||||||||
| South Korea | vehicles | 83.9 | 83.9 | 78.1 | 75.5 | 73.9 | ||||||||||||||||
| USA | vehicles | 13.3 | 12.9 | 12.1 | 9.30 | 8.50 | ||||||||||||||||
| World | vehicles | 9.39 | 9.46 | 9.89 | 9.96 | 9.48 |
 Helgi Library


