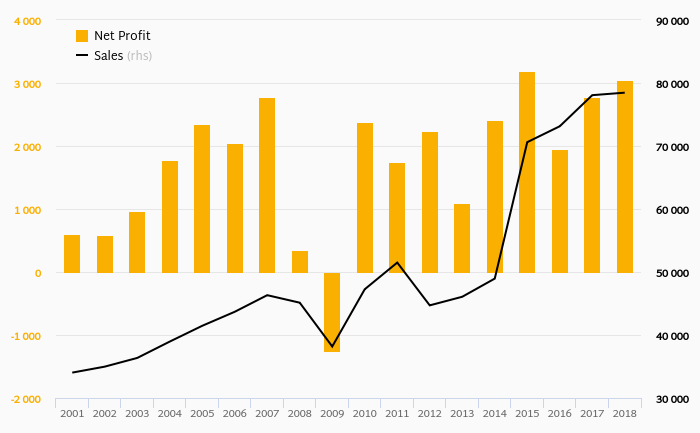
Robert Bosch's operating cash flow stood at EUR 7,267 mil in 2018, up 6.88% when compared to the previous year. Historically, between 2001 - 2018, the firm’s operating cash flow reached a high of EUR 7,267 mil in 2018 and a low of EUR 2,717 mil in 2011.
Robert Bosch's total investments stood at EUR -6,110 mil and accounted for of sales in 2018. This is compared to an average of
Severity: Warning
Message: Division by zero
Filename: models/Chunks_model.php
Line Number: 420
Cash from financing amounted to EUR -999 mil, so the company generated EUR 158 mil net cash in 2018.
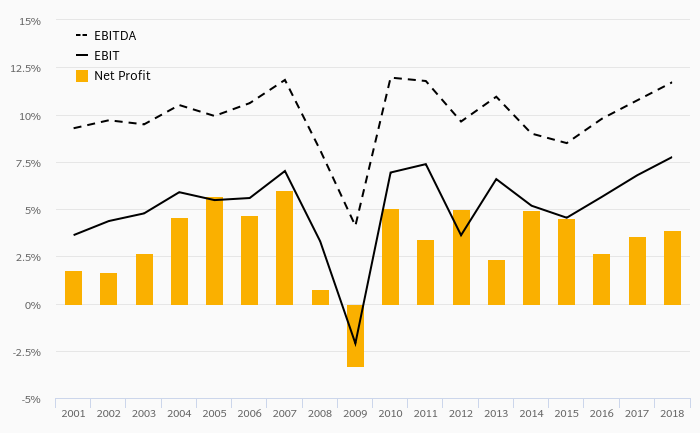
At the end of 2018, the company had a net debt of EUR -672 mil, or -0.073x of EBITDA and -0.017 of equity. Net working capital amounted to EUR 12,187 mil, or 15.5% of sales. Cash conversion cycle is negative and reached 35.8 days days in 2018. This means Robert Bosch generates revenue from customers before it has to pay its suppliers for inventory, among other things.
You can see all the company’s data at Robert Bosch profile, or you can download a report on the company in the report section.
 Helgi Library