Institutional Sign In

Go

Samsara - Profit Margins

Net Profit, EBIT & EBITDA as % of Sales
Telcos & Hi-Tech | USA | September 6, 2022
$2.99
Excel Sheet

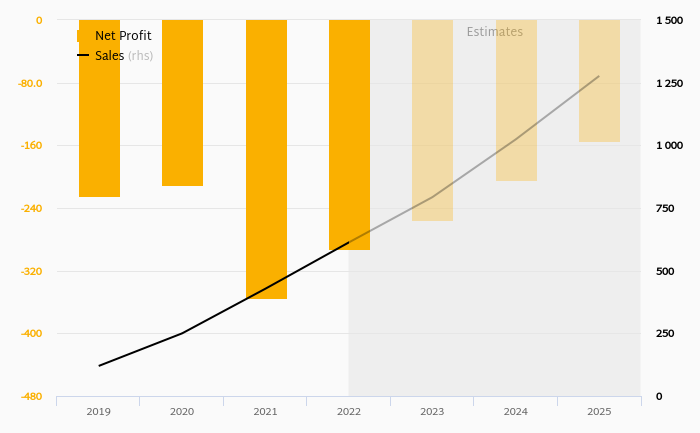
Samsara made a net profit of USD -293 mil with revenues of USD 613 mil in 2022, up by 17.6% and up by 43.1%, respectively, compared to the previous year.

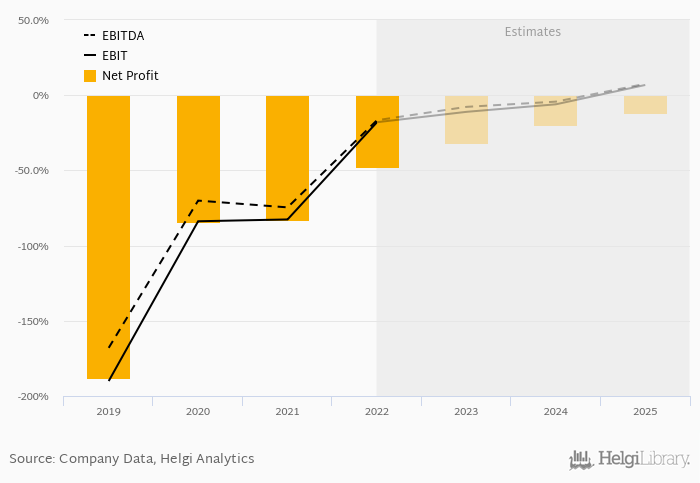
This translates into a net margin of -47.7%. Historically, between 2019 and 2022, the firm’s net margin reached a high of -47.7% in 2022 and a low of -188% in 2019. The average net margin in the last five years amounted to -101%.

On the operating level, the EBITDA margin reached -16.6% and EBIT amounted to -18.0% of sales in 2022.

You can see all the company’s data at Samsara profile, or you can download a report on the company in the report section.

Net Margin Unit 1978 1979 1980 1981 1982 1983 1984 1985 1986 1987 1988 1989 1990 1991 1992 1993 1994 1995 1996 1997 1998 1999 2000 2001 2002 2003 2004 2005 2006 2007 2008 2009 2010 2011 2012 2013 2014 2015 2016 2017 2018 2019 2020 2021 2022 2023 2024 2025 2026 2027
Alphabet % ... ... ... ... ... ... ... ... ... ... ... ... ... ... ... ... ... ... ... ... ... 21.6% 11.4% 22.5% 21.2% ... ... ... ... ... ... ... ...
Amazon.com Inc % ... ... ... ... ... ... ... ... ... ... ... ... ... ... ... ... ... ... ... ... 1.74% 1.71% 4.33% ... ... ... ... ... ... ... ... ...
Apple Inc. % ... ... ... ... ... ... ... ... ... ... ... ... ... ... ... ... ... ... ... ... ... ... ... ... ... ... ... 20.7% 21.1% 22.7% 21.5% 21.7%
Badger Meter % ... ... ... ... ... ... ... ... ... ... ... ... ... ... ... ... ... ... ... ... ... ... ... ... ... ... ... ... 8.20% 8.59% 6.41% 11.1% 11.6% ...
Broadcom % ... ... ... ... ... ... ... ... ... ... ... ... ... ... ... ... ... ... ... ... ... ... ... ... ... ... ... ... -12.0% 40.8% 30.5% 11.6% 16.0% ... ...
CalAmp % ... ... ... ... ... ... ... ... ... ... ... ... ... ... ... ... ... ... ... ... ... ... ... ... ... ... ... ... ... ... ... ... ... 0.548% 4.79% 0.633% -3.36% -34.0% ... ...
Digi International % ... ... ... ... ... ... ... ... ... ... ... ... ... ... ... ... ... ... ... ... ... ... ... ... ... ... ... ... ... ... ... ... ... 6.37% 1.39% 4.30% 2.16% 2.72% ... ...
Facebook % ... ... ... ... ... ... ... ... ... ... ... ... ... ... ... ... ... ... ... ... ... ... ... ... ... ... ... ... ... 36.9% 39.2% 39.6% 26.1% ... ... ... ... ... ... ... ...
Hubbell % ... ... ... ... ... ... ... ... ... ... ... ... ... ... ... ... ... ... ... ... ... ... ... ... ... ... ... ... 8.36% 6.63% 8.04% 8.73% 9.54% ...
Itron % ... ... ... ... ... ... ... ... ... ... ... ... ... ... ... ... ... ... ... ... ... ... ... ... ... ... ... ... ... ... ... ... ... 1.58% 2.84% -4.18% 1.96% -2.67%
KORE % ... ... ... ... ... ... ... ... ... ... ... ... ... ... ... ... ... ... ... ... ... ... ... ... ... ... ... ... ... ... ... ... ... ... ... ... ... ... ... ... ... -13.9% -16.5%
Microsoft Corporation % ... ... ... ... ... ... ... ... ... ... ... ... ... ... ... ... ... ... ... ... ... ... ... 18.4% 26.4% 15.0% 31.2% ... ... ... ... ... ... ... ...
Motorola Solutions % ... ... ... ... ... ... ... ... ... ... ... ... ... ... ... ... ... 9.27% -2.43% 13.2% 11.0% ... ... ... ... ... ... ... ...
PTC % ... ... ... ... ... ... ... ... ... ... ... ... ... ... ... ... ... ... ... ... ... ... ... ... ... ... ... ... ... ... ... ... ... -3.50% 2.47% 4.65% -1.02% 7.75% ...
Samsara % ... ... ... ... ... ... ... ... ... ... ... ... ... ... ... ... ... ... ... ... ... ... ... ... ... ... ... ... ... ... ... ... ... ... ... ... ... ... ... ... ... -188% -84.1% ... ...
Sensata Technologies % ... ... ... ... ... ... ... ... ... ... ... ... ... ... ... ... ... ... ... ... ... ... ... ... ... ... ... ... ... 8.20% 12.3% 17.0% 8.19% 5.39% ...
Sierra Wireless % ... ... ... ... ... ... ... ... ... ... ... ... ... ... ... ... ... ... ... ... ... ... ... ... ... ... ... ... ... ... ... ... ... 2.50% 0.654% -3.10% -12.9% -11.0% ... ...
AVERAGE % ... ... ... ... ... ... ... ... ... ... ... ... ... ... ... ... ... 7.57% 4.13% 3.96% -11.8% -934% -41.5% 1.44% 7.11% 8.64% 12.0% 16.3% 9.16% -2.88% 4.65% 10.8% 16.1% 9.62% 10.4% 13.0% 11.1% 9.90% 8.59% 11.9% 12.1% -4.01% -6.13% -0.707% 2.61% 6.65% 9.71% 11.3% 14.1% 14.2%

Related Indicators