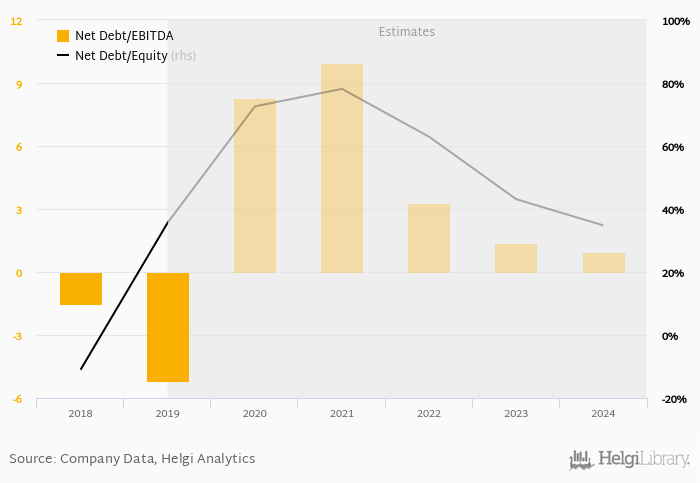
Saneca Pharmaceuticals's net debt stood at EUR 8.68 mil and accounted for 35.7% of equity at the end of 2019. The ratio is up 46.7 pp compared to the previous year.
Historically, the firm’s net debt to equity reached a high of 35.7% in 2019 and a low of -11.0% in 2018 between 2018 and 2019. The average for the last five years was 12.3%.
Net debt to EBITDA was calculated at -5.20x at the end of the year. That is down from x seen in 2014. The ratio reached a high of -1.52x in 2018 and a low of -5.20x in 2019.
The company’s cost of funding amounted to in 2019,
Severity: Warning
Message: Division by zero
Filename: models/Chunks_model.php
Line Number: 515
You can see all the company’s data at Saneca Pharmaceuticals profile, or you can download a report on the company in the report section.
 Helgi Library