State Bank of India stock traded at INR 271 per share at the end of third quarter of 2019 implying a market capitalization of USD 34,191 mil.
Over the last five years, the stock has appreciated by 10.7 % implying an annual average growth of 2.06 %. In absolute terms, the value of the company rose by USD 33,710 mil.
Historically, the bank’s stock price reached an all time high of INR 362 in 2Q2019 and an all time low of INR 161 in 3Q2013.
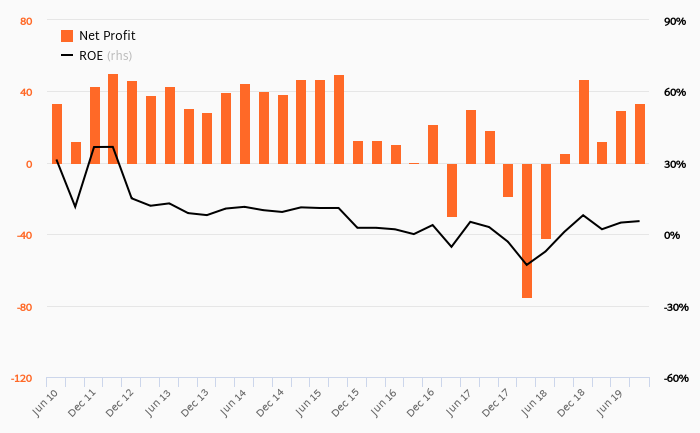
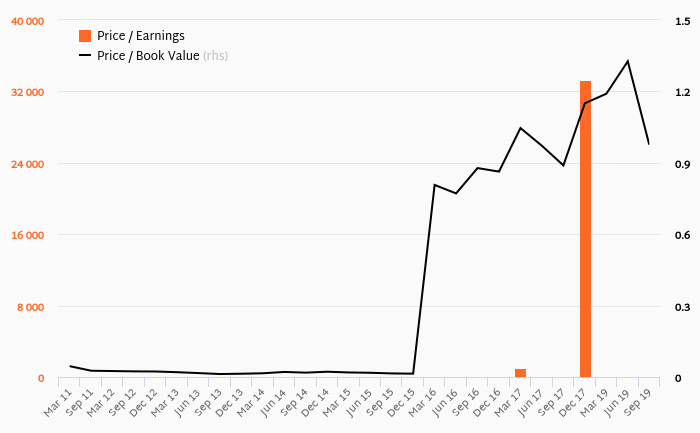
At the end of third quarter of 2019, the bank traded at price to earnings of 19.7x and price to book value of 0.976x. The bank generated its shareholders an average return on equity of 5.33% in the last five years and average dividend yield of 0%.
You can see all the bank’s data at State Bank of India profile, or you can download a report on the bank in the report section.
Share Price (End Of Period) | Unit | Jun 2007 | Sep 2007 | Dec 2007 | Mar 2008 | Jun 2008 | Sep 2008 | Dec 2008 | Mar 2009 | Jun 2009 | Sep 2009 | Dec 2009 | Mar 2010 | Jun 2010 | Sep 2010 | Dec 2010 | Mar 2011 | Jun 2011 | Sep 2011 | Dec 2011 | Mar 2012 | Jun 2012 | Sep 2012 | Dec 2012 | Mar 2013 | Jun 2013 | Sep 2013 | Dec 2013 | Mar 2014 | Jun 2014 | Sep 2014 | Dec 2014 | Mar 2015 | Jun 2015 | Sep 2015 | Dec 2015 | Mar 2016 | Jun 2016 | Sep 2016 | Dec 2016 | Mar 2017 | Jun 2017 | Sep 2017 | Dec 2017 | Mar 2018 | Jun 2018 | Sep 2018 | Dec 2018 | Mar 2019 | Jun 2019 | Sep 2019 |
Dhanlaxmi Bank | INR | ... | ... | ... | ... | ... | ... | ... | ... | ... | ... | 21.5 | 18.4 | 11.1 | 16.8 | 16.8 | ... | ||||||||||||||||||||||||||||||||||
State Bank of India | INR | ... | ... | ... | ... | ... | ... | ... | ... | ... | ... | ... | ... | 271 | 259 | 266 | 296 | 321 | |||||||||||||||||||||||||||||||||
AVERAGE | INR | ... | ... | ... | ... | ... | ... | ... | ... | ... | ... | 146 | 133 | 209 | 255 | 203 | 195 | 179 | 132 | 103 | 145 | 135 | 140 | 152 | 128 | 114 | 101 | 109 | 116 | 162 | 144 | 176 | 149 | 146 | 134 | 123 | 108 | 121 | 138 | 136 | 162 | 161 | 146 | 170 | 146 | 139 | 138 | 156 | 169 | 189 | 271 |