
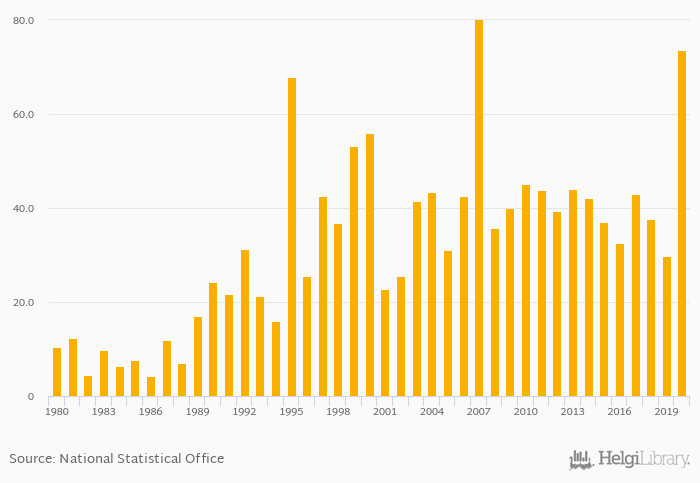
Stocks traded, total value as of GDP rose 148% to 73.7% in Malaysia in 2020, according to OECD.
Historically, stocks traded, total value as of GDP in Malaysia reached an all time high of 79.9% in 2007 and an all time low of 4.21% in 1986.
Malaysia has been ranked 13th within the group of 65 countries we follow in terms of stocks traded, total value as of GDP, 9 places above the position seen 10 years ago.
| Stocks Traded, Total Value (As % of GDP) | Unit | 2000 | 2001 | 2002 | 2003 | 2004 | 2005 | 2006 | 2007 | 2008 | 2009 | 2010 | 2011 | 2012 | 2013 | 2014 | 2015 | 2016 | 2017 | 2018 | 2019 | 2020 |
| Cambodia | % | ... | ... | ... | ... | ... | ... | ... | ... | ... | ... | ... | ... | ... | ... | ... | ... | ... | ... | ... | ... | ... |
| China | % | 114% | 356% | 163% | 140% | 94.1% | ||||||||||||||||
| Indonesia | % | 10.2% | 8.72% | 9.70% | 9.11% | 10.0% | ||||||||||||||||
| Laos | % | ... | ... | ... | ... | ... | ... | ... | ... | ... | ... | ... | ... | ... | ... | ... | ... | ... | ... | ... | ... | ... |
| Malaysia | % | 42.2% | 37.0% | 32.6% | 43.1% | 37.7% | ||||||||||||||||
| Myanmar | % | ... | ... | ... | ... | ... | ... | ... | ... | ... | ... | ... | ... | ... | ... | ... | ... | ... | ... | ... | ... | ... |
| Philippines | % | 14.2% | 12.5% | 11.3% | 10.3% | 8.42% | ||||||||||||||||
| Singapore | % | 63.7% | 64.3% | 59.0% | 64.0% | 58.2% | ... | |||||||||||||||
| Thailand | % | 76.3% | 67.6% | 78.6% | 74.4% | 76.3% | ||||||||||||||||
| Vietnam | % | ... | ... | ... | 12.8% | 9.92% | 10.5% | 15.7% | 17.0% |
 Helgi Library


