
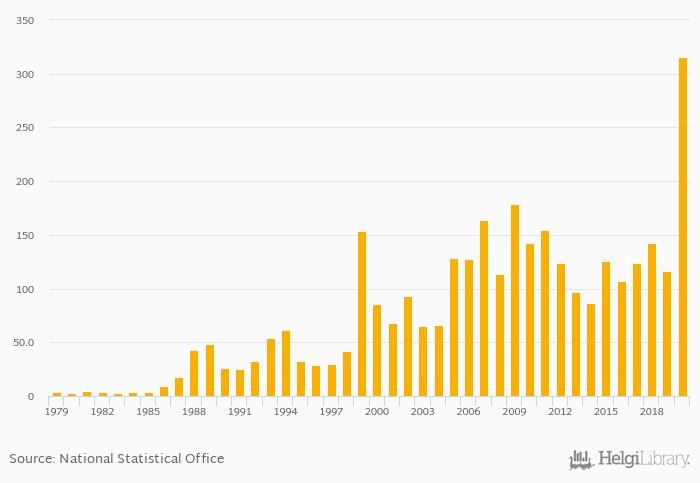
Stocks traded, total value as of GDP rose 170% to 316% in South Korea in 2020, according to OECD.
Historically, stocks traded, total value as of GDP in South Korea reached an all time high of 316% in 2020 and an all time low of 2.51% in 1983.
South Korea has been ranked 2nd within the group of 65 countries we follow in terms of stocks traded, total value as of GDP, 2 places above the position seen 10 years ago.
| Stocks Traded, Total Value (As % of GDP) | Unit | 2000 | 2001 | 2002 | 2003 | 2004 | 2005 | 2006 | 2007 | 2008 | 2009 | 2010 | 2011 | 2012 | 2013 | 2014 | 2015 | 2016 | 2017 | 2018 | 2019 | 2020 |
| Cambodia | % | ... | ... | ... | ... | ... | ... | ... | ... | ... | ... | ... | ... | ... | ... | ... | ... | ... | ... | ... | ... | ... |
| China | % | 114% | 356% | 163% | 140% | 94.1% | ||||||||||||||||
| Dem. People's Republic of Korea | % | ... | ... | ... | ... | ... | ... | ... | ... | ... | ... | ... | ... | ... | ... | ... | ... | ... | ... | ... | ... | ... |
| India | % | 37.3% | 38.1% | 35.2% | 45.4% | 47.9% | ||||||||||||||||
| Japan | % | 98.9% | 125% | 105% | 117% | 125% | ||||||||||||||||
| Laos | % | ... | ... | ... | ... | ... | ... | ... | ... | ... | ... | ... | ... | ... | ... | ... | ... | ... | ... | ... | ... | ... |
| Russia | % | 7.77% | 8.60% | 10.9% | 9.24% | 8.88% | ||||||||||||||||
| South Korea | % | 86.5% | 126% | 107% | 124% | 142% | ||||||||||||||||
| Thailand | % | 76.3% | 67.6% | 78.6% | 74.4% | 76.3% | ||||||||||||||||
| USA | % | 222% | 227% | 225% | 204% | 161% | ... | |||||||||||||||
| Vietnam | % | ... | ... | ... | 12.8% | 9.92% | 10.5% | 15.7% | 17.0% |
 Helgi Library


