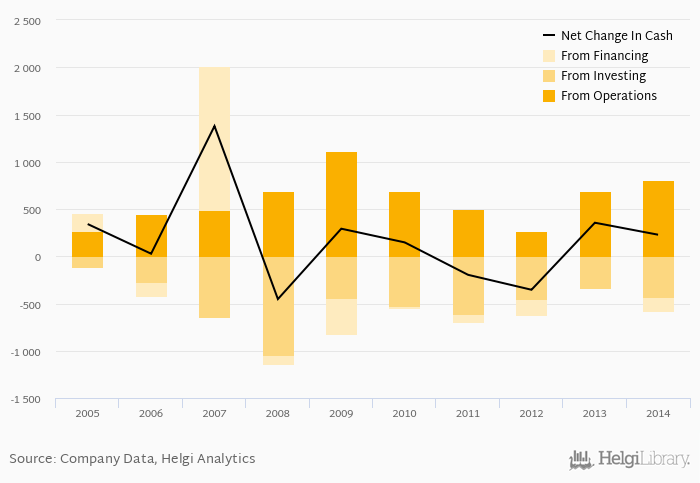
Strabag SE's operating cash flow stood at EUR 805 mil in 2014, up 16.1% when compared to the previous year. Historically, between 2005 - 2014, the firm’s operating cash flow reached a high of EUR 1,115 mil in 2009 and a low of EUR 268 mil in 2005.
Strabag SE's total investments stood at EUR -435 mil and accounted for 2.78% of sales in 2014. This is compared to an average of 3.48% as seen over the last five years.
Cash from financing amounted to EUR -142 mil, so the company generated EUR 228 mil net cash in 2014.
At the end of 2014, the company had a net debt of EUR -314 mil, or -0.436x of EBITDA and -0.100 of equity. Net working capital amounted to EUR 593 mil, or 4.75% of sales. The cash conversion cycle stood at -11.7 days in 2014. This is a deterioration compared to the previous year (-2.02 days), so Strabag SE’s working capital was tied up for 9.69 more days.
You can see all the company’s data at Strabag SE profile, or you can download a report on the company in the report section.
 Helgi Library