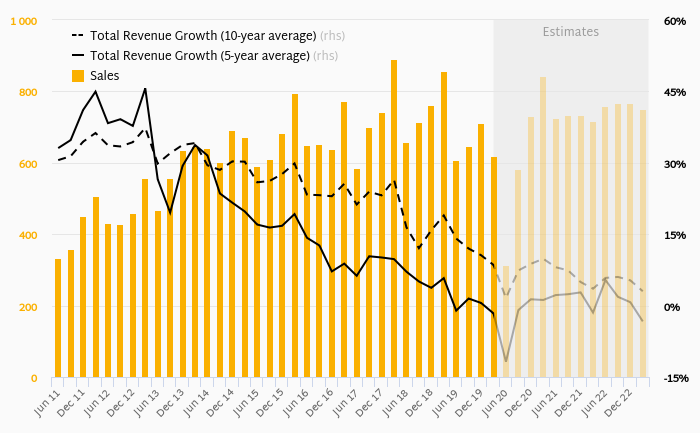
Tata Motors made a net profit of INR -98.9 bil with revenues of INR 619 bil in 1Q2020, down by 985% and down by 27.7%, respectively, compared to the previous year. This translates into a net margin of -16.0%.
On the operating level, EBITDA reached INR 23.7 bil, down 70.4% compared to the previous year. Over the last five years, the company's EBITDA has fallen 22.4% a year on average.
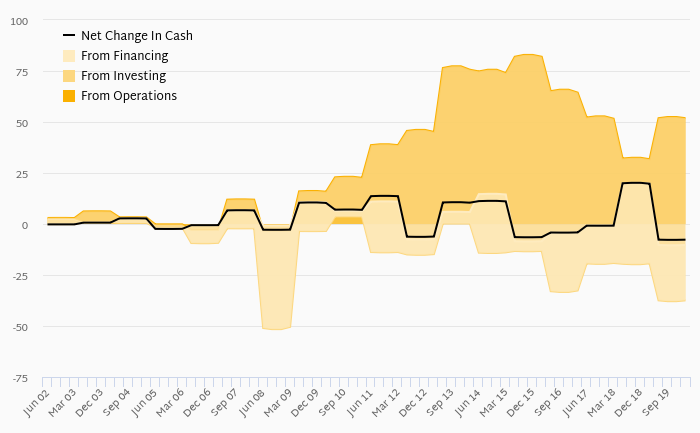
The company generated cash, defined by a sum of net profit and depreciation, of INR -72.6 bil or -11.7% of sales. When investments are excluded, free cash flow reached INR -37.4 bil, or -6.04% of sales in 1Q2020.
In the last five years, the company generated free cash flow of INR -492 bil. That compares to a cumulative net profit of INR -129 bil in the same period.
You can see all the company’s data at Tata Motors profile, or you can download a report on the company in the report section.
Net Profit | Unit | Dec 2010 | Mar 2011 | Jun 2011 | Sep 2011 | Dec 2011 | Mar 2012 | Jun 2012 | Sep 2012 | Dec 2012 | Mar 2013 | Jun 2013 | Sep 2013 | Dec 2013 | Mar 2014 | Jun 2014 | Sep 2014 | Dec 2014 | Mar 2015 | Jun 2015 | Sep 2015 | Dec 2015 | Mar 2016 | Jun 2016 | Sep 2016 | Dec 2016 | Mar 2017 | Jun 2017 | Sep 2017 | Dec 2017 | Mar 2018 | Jun 2018 | Sep 2018 | Dec 2018 | Mar 2019 | Jun 2019 | Sep 2019 | Dec 2019 | Mar 2020 | Jun 2020 (E) | Sep 2020 (E) | Dec 2020 (E) | Mar 2021 (E) | Jun 2021 (E) | Sep 2021 (E) | Dec 2021 (E) | Mar 2022 (E) | Jun 2022 (E) | Sep 2022 (E) | Dec 2022 (E) | Mar 2023 (E) |
Tata Motors | INR bil | -10.5 | -270 | 11.2 | -37.0 | -2.17 | |||||||||||||||||||||||||||||||||||||||||||||
AVERAGE | INR bil | 24.2 | 26.4 | 20.0 | 18.8 | 34.1 | 62.3 | 22.4 | 20.7 | 16.3 | 39.5 | 17.3 | 35.4 | 48.0 | 39.2 | 54.0 | 32.9 | 35.8 | 17.2 | 52.3 | -17.6 | 29.3 | 51.8 | 22.4 | 8.28 | 0.938 | 43.0 | 31.8 | 24.8 | 12.0 | 21.3 | -19.0 | -10.5 | -270 | 11.2 | -37.0 | -2.17 | 17.4 | -98.9 | -84.4 | -37.3 | -12.8 | 10.8 | 7.53 | 7.62 | 7.62 | 7.45 | 13.6 | 13.7 | 13.7 | 13.4 |