
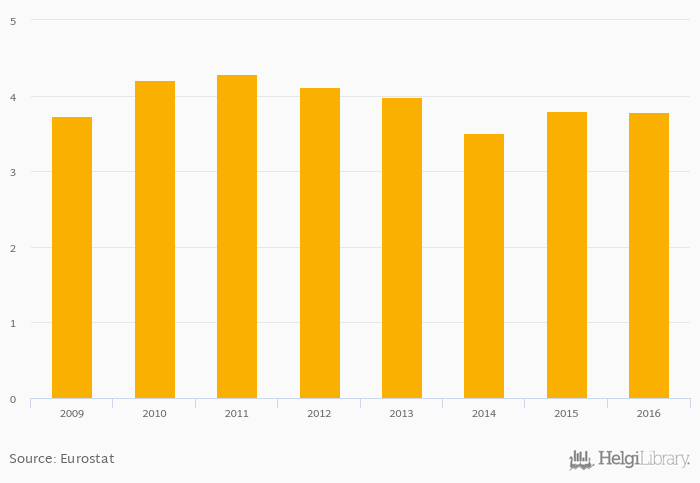
Total labour force in agriculture fell 0.526% to 3.78 '000 in Iceland in 2016, according to Faostat.
Historically, total labour force in agriculture in Iceland reached an all time high of 4.29 '000 in 2011 and an all time low of 3.50 '000 in 2014.
Iceland has been ranked 28th within the group of 29 countries we follow in terms of total labour force in agriculture, 28 places below the position seen 10 years ago.
| Total Labour Force in Agriculture | Unit | 1996 | 1997 | 1998 | 1999 | 2000 | 2001 | 2002 | 2003 | 2004 | 2005 | 2006 | 2007 | 2008 | 2009 | 2010 | 2011 | 2012 | 2013 | 2014 | 2015 | 2016 |
| Belgium | '000 | 61.9 | 57.6 | 58.1 | 57.9 | 57.3 | ||||||||||||||||
| Denmark | '000 | 54.2 | 52.1 | 52.5 | 52.7 | 54.1 | ||||||||||||||||
| Finland | '000 | 82.1 | 81.2 | 79.5 | 75.9 | 81.2 | ||||||||||||||||
| France | '000 | 809 | 800 | 788 | 781 | 775 | ||||||||||||||||
| Germany | '000 | 522 | 518 | 514 | 503 | 504 | ||||||||||||||||
| Iceland | '000 | ... | ... | ... | ... | ... | ... | ... | ... | ... | ... | ... | ... | ... | 4.21 | 4.29 | 4.12 | 3.98 | 3.50 | |||
| Ireland | '000 | 166 | 166 | 165 | 164 | 164 | ||||||||||||||||
| Netherlands | '000 | 150 | 149 | 147 | 148 | 146 | ||||||||||||||||
| Norway | '000 | 51.4 | 50.3 | 49.2 | 48.1 | 47.0 | ||||||||||||||||
| Russia | '000 | ... | ... | ... | ... | ... | ... | ... | ... | ... | ... | ... | ... | ... | ... | ... | ... | ... | ... | ... | ... | ... |
| Sweden | '000 | 65.3 | 64.2 | 63.1 | 62.1 | 61.0 | ||||||||||||||||
| United Kingdom | '000 | ... | ... | ... | ... | ... | ... | ... | ... | ... | ... | ... | ... | ... | ... | ... | ... | ... | ... | ... | ... | ... |
 Helgi Library


