
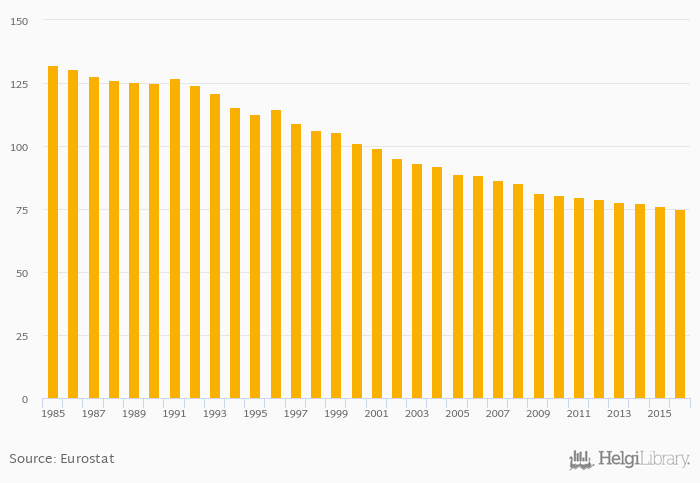
Total labour force in agriculture fell 1.43% to 75.0 '000 in Switzerland in 2016, according to Faostat.
Historically, total labour force in agriculture in Switzerland reached an all time high of 132 '000 in 1985 and an all time low of 75.0 '000 in 2016. When compared to Switzerland's main peers, total labour force in agriculture in Austria amounted to 118 '000, 762 '000 in France, 494 '000 in Germany and 1,143 '000 in Italy in 2016.
Switzerland has been ranked 18th within the group of 29 countries we follow in terms of total labour force in agriculture, 3 places above the position seen 10 years ago.
| Total Labour Force in Agriculture | Unit | 1996 | 1997 | 1998 | 1999 | 2000 | 2001 | 2002 | 2003 | 2004 | 2005 | 2006 | 2007 | 2008 | 2009 | 2010 | 2011 | 2012 | 2013 | 2014 | 2015 | 2016 |
| Austria | '000 | 127 | 126 | 125 | 124 | 122 | ||||||||||||||||
| Belgium | '000 | 61.9 | 57.6 | 58.1 | 57.9 | 57.3 | ||||||||||||||||
| France | '000 | 809 | 800 | 788 | 781 | 775 | ||||||||||||||||
| Germany | '000 | 522 | 518 | 514 | 503 | 504 | ||||||||||||||||
| Hungary | '000 | 444 | 437 | 433 | 444 | 463 | ||||||||||||||||
| Italy | '000 | 1,164 | 1,123 | 1,094 | 1,078 | 1,095 | ||||||||||||||||
| Poland | '000 | 1,915 | 1,915 | 1,915 | 1,937 | 1,937 | ||||||||||||||||
| Slovenia | '000 | 77.0 | 78.0 | 80.8 | 82.8 | 81.8 | ||||||||||||||||
| Spain | '000 | 964 | 903 | 890 | 842 | 824 | ||||||||||||||||
| Switzerland | '000 | 80.7 | 79.9 | 79.1 | 77.7 | 77.4 |
 Helgi Library


