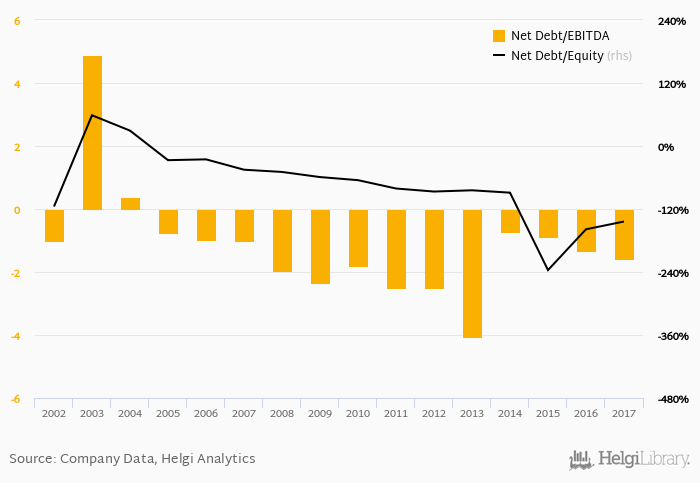
Vema's net debt stood at CZK -35.8 mil and accounted for -144% of equity at the end of 2017. The ratio is up 14.8 pp compared to the previous year.
Historically, the firm’s net debt to equity reached a high of 58.5% in 2003 and a low of -236% in 2015 between 2002 and 2017. The average for the last five years was -142%.
Net debt to EBITDA was calculated at -1.59x at the end of the year. That is down from -2.49x seen in 2012. The ratio reached a high of 4.88x in 2003 and a low of -4.08x in 2013.
The company’s cost of funding amounted to in 2017, up which is above the 5-year of -618%. Funding costs have “eaten” some 17.8% of the operating profit generated in 2019.
You can see all the company’s data at Vema profile, or you can download a report on the company in the report section.
 Helgi Library