
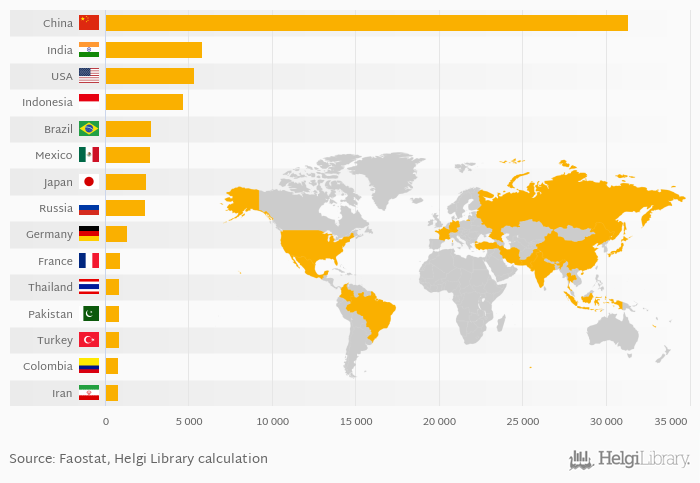
Based on a comparison of 165 countries in 2021, China ranked the highest in egg consumption with 31,320 kt followed by India and USA. On the other end of the scale was South Sudan with 0.424 kt, Guyana with 1.00 kt and Seychelles with 1.00 kt.
Total egg consumption reached 81,786 kt in 2021 in the World according to Faostat. This is 1.06 % less than in the previous year and 24.0 % more than 10 years ago.
Historically, total egg consumption reached an all time high of 82,654 kt in 2020 and an all time low of 14,027 kt in 1961. The average annual growth amounted to 2.98 % since 1961.
The top ranked country, China, accounted for 38.3 % of egg consumption in the world. The top 3 countries hold a 51.9 % share while the ten largest countries some 72.9 % in 2021.
Data for more countries are available at Egg Consumption (Total) indicator page.
| Egg Consumption (Total) | Unit | 2001 | 2002 | 2003 | 2004 | 2005 | 2006 | 2007 | 2008 | 2009 | 2010 | 2011 | 2012 | 2013 | 2014 | 2015 | 2016 | 2017 | 2018 | 2019 | 2020 | 2021 |
| Brazil | kt | 1,965 | 1,951 | 2,146 | 2,539 | 2,639 | ||||||||||||||||
| China | kt | 27,984 | 29,033 | 28,432 | 28,741 | 30,405 | ||||||||||||||||
| Colombia | kt | 563 | 594 | 641 | 677 | 667 | ||||||||||||||||
| France | kt | 867 | 744 | 807 | 786 | 875 | ||||||||||||||||
| Germany | kt | 1,143 | 1,194 | 1,191 | 1,236 | 1,451 | ||||||||||||||||
| India | kt | 3,655 | 3,887 | 4,140 | 4,479 | 5,415 | ||||||||||||||||
| Indonesia | kt | 1,317 | 1,418 | 4,015 | 4,063 | 4,034 | ||||||||||||||||
| Iran | kt | 708 | 739 | 615 | 679 | 852 | ||||||||||||||||
| Japan | kt | 2,432 | 2,473 | 2,501 | 2,524 | 2,529 | ||||||||||||||||
| Mexico | kt | 2,358 | 2,422 | 2,458 | 2,531 | 2,601 | ||||||||||||||||
| Pakistan | kt | 600 | 638 | 680 | 719 | 753 | ||||||||||||||||
| Russia | kt | 2,238 | 2,278 | 2,339 | 2,407 | 2,427 | ||||||||||||||||
| Thailand | kt | 832 | 829 | 831 | 841 | 840 | ||||||||||||||||
| Turkey | kt | 688 | 690 | 695 | 716 | 807 | ||||||||||||||||
| USA | kt | 4,698 | 4,924 | 5,149 | 5,303 | 5,418 |
 Helgi Library


