
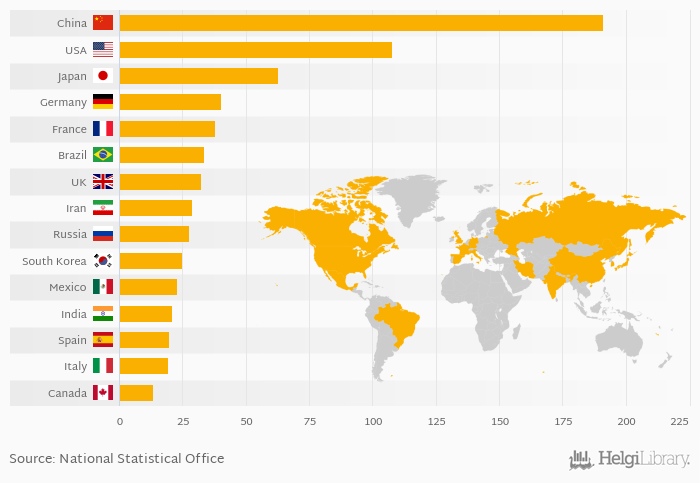
Based on a comparison of 174 countries in 2019, China ranked the highest in number of fixed lines with 191 mil followed by USA and Japan. On the other end of the scale was Somalia with < 0.001 mil, East Timor with 0.002 mil and Central African Republic with 0.002 mil.
Average number of fixed lines reached 914 mil in 2019 in the World according to World Bank. This is 0 % the same as in the previous year.
Historically, average number of fixed lines reached an all time high of 1,261 mil in 2006 and an all time low of 116 mil in 1965. The average annual growth amounted to -0.570 % since 1960.
Data for more countries are available at Number of Fixed Lines indicator page.
| Number of Fixed Lines | Unit | 2001 | 2002 | 2003 | 2004 | 2005 | 2006 | 2007 | 2008 | 2009 | 2010 | 2011 | 2012 | 2013 | 2014 | 2015 | 2016 | 2017 | 2018 | 2019 | 2020 | 2021 |
| Brazil | mil | 43.7 | 42.0 | 40.4 | 38.3 | 33.7 | ||||||||||||||||
| Canada | mil | 15.6 | 15.2 | 14.5 | 13.8 | 13.6 | ||||||||||||||||
| China | mil | 231 | 207 | 194 | 192 | 191 | ||||||||||||||||
| France | mil | 38.9 | 39.0 | 38.7 | 38.1 | 37.8 | ... | |||||||||||||||
| Germany | mil | 45.4 | 45.3 | 44.4 | 42.5 | 40.4 | ||||||||||||||||
| India | mil | 25.5 | 24.4 | 23.2 | 21.9 | 21.0 | ||||||||||||||||
| Iran | mil | 30.4 | 30.9 | 31.1 | 30.5 | 29.0 | ||||||||||||||||
| Italy | mil | 20.2 | 20.3 | 20.7 | 20.4 | 19.5 | ||||||||||||||||
| Japan | mil | 63.7 | 64.1 | 64.0 | 63.4 | 62.7 | ||||||||||||||||
| Mexico | mil | 20.2 | 20.8 | 20.8 | 21.6 | 22.7 | ||||||||||||||||
| Russia | mil | 35.6 | 32.3 | 32.0 | 30.1 | 27.7 | ... | |||||||||||||||
| South Korea | mil | 28.9 | 28.0 | 26.8 | 25.9 | 24.7 | ||||||||||||||||
| Spain | mil | 19.4 | 19.5 | 19.6 | 19.8 | 19.6 | ||||||||||||||||
| USA | mil | 125 | 121 | 116 | 110 | 106 | ||||||||||||||||
| United Kingdom | mil | 33.2 | 32.6 | 31.8 | 31.5 | 32.7 |
 Helgi Library


