
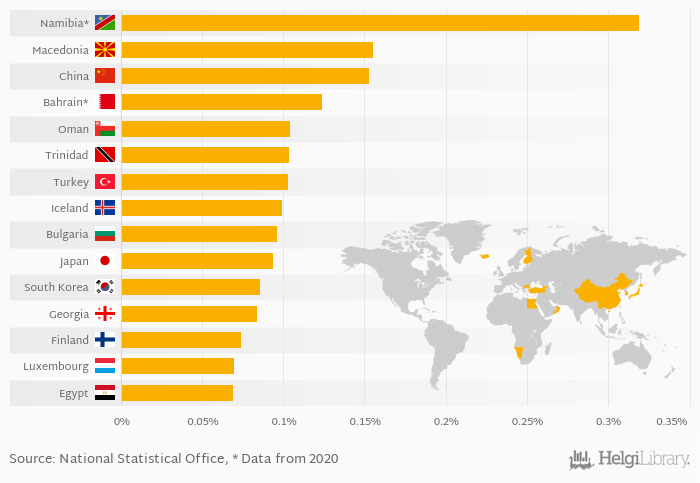
Based on a comparison of 147 countries in 2021, Namibia ranked the highest in ores and metal imports as a percentage of merchandise imports with 0.319% followed by Macedonia and China. On the other end of the scale was Mongolia with 0.003%, Comoros with 0.003% and Honduras with 0.004%.
Average ores and metal imports as a percentage of merchandise imports reached 0.053% in 2021 in the World according to the National Statistical Office. This is 14.2 % more than in the previous year and 4.91 % more than 10 years ago.
Historically, average ores and metal imports as a percentage of merchandise imports reached an all time high of 0.079% in 1966 and an all time low of 0.030% in 2002. The average annual growth amounted to -0.648 % since 1962.
Data for more countries are available at Ores and Metal Imports (As % of Merchandise Imports) indicator page.
| Ores and Metal Imports (As % of Merchandise Imports) | Unit | 2001 | 2002 | 2003 | 2004 | 2005 | 2006 | 2007 | 2008 | 2009 | 2010 | 2011 | 2012 | 2013 | 2014 | 2015 | 2016 | 2017 | 2018 | 2019 | 2020 | 2021 |
| Bahrain | % | 0.079% | 0.067% | 0.081% | 0.101% | 0.125% | ... | |||||||||||||||
| Bulgaria | % | 0.088% | 0.074% | 0.097% | 0.096% | 0.081% | ||||||||||||||||
| China | % | 0.102% | 0.102% | 0.113% | 0.107% | 0.119% | ||||||||||||||||
| Egypt | % | 0.030% | 0.030% | 0.044% | 0.051% | 0.050% | ||||||||||||||||
| Finland | % | 0.051% | 0.049% | 0.050% | 0.053% | 0.053% | ||||||||||||||||
| Georgia | % | 0.041% | 0.044% | 0.053% | 0.055% | 0.074% | ||||||||||||||||
| Iceland | % | 0.119% | 0.095% | 0.108% | 0.131% | 0.115% | ||||||||||||||||
| Japan | % | 0.063% | 0.058% | 0.064% | 0.064% | 0.064% | ||||||||||||||||
| Luxembourg | % | 0.058% | 0.053% | 0.062% | 0.065% | 0.055% | ||||||||||||||||
| Macedonia | % | 0.149% | 0.146% | 0.153% | 0.148% | 0.172% | ||||||||||||||||
| Namibia | % | 0.087% | 0.082% | 0.134% | 0.187% | 0.237% | ... | |||||||||||||||
| Oman | % | 0.052% | 0.055% | 0.075% | 0.071% | 0.081% | ||||||||||||||||
| South Korea | % | 0.067% | 0.066% | 0.067% | 0.065% | 0.067% | ||||||||||||||||
| Trinidad and Tobago | % | 0.036% | 0.033% | 0.053% | 0.045% | 0.070% | ||||||||||||||||
| Turkey | % | 0.060% | 0.057% | 0.067% | 0.078% | 0.072% |
 Helgi Library


