
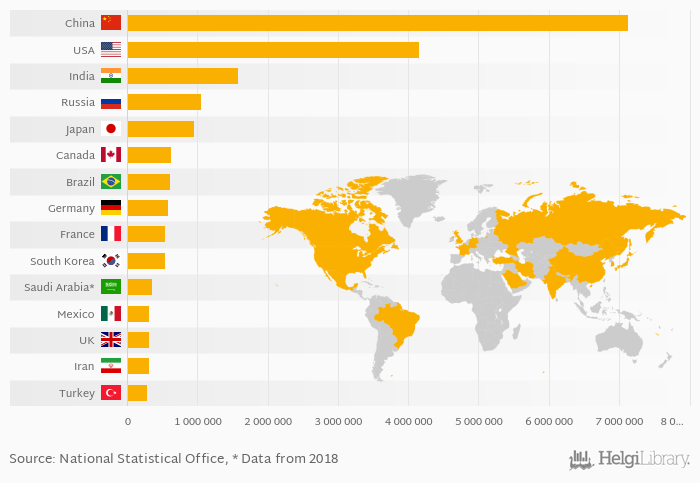
Based on a comparison of 175 countries in 2019, China ranked the highest in electric power production with 7,136,226 GWh followed by USA and India. On the other end of the scale was Djibouti with 41.0 GWh, Guinea Bissau with 42.0 GWh and Luxembourg with 86.7 GWh.
Data for more countries are available at Electric Power Production indicator page.
| Electric Power Production | Unit | 1999 | 2000 | 2001 | 2002 | 2003 | 2004 | 2005 | 2006 | 2007 | 2008 | 2009 | 2010 | 2011 | 2012 | 2013 | 2014 | 2015 | 2016 | 2017 | 2018 | 2019 |
| Brazil | GWh | 559,372 | 577,739 | 568,688 | 567,965 | 577,962 | ||||||||||||||||
| Canada | GWh | 640,240 | 636,222 | 639,405 | 645,739 | 645,125 | ||||||||||||||||
| China | GWh | 5,170,660 | 5,387,911 | 5,562,476 | 5,883,822 | 6,283,525 | ||||||||||||||||
| France | GWh | 551,127 | 543,276 | 551,016 | 536,700 | 533,911 | ||||||||||||||||
| Germany | GWh | 601,713 | 591,711 | 612,118 | 614,774 | 618,310 | ||||||||||||||||
| India | GWh | 1,154,172 | 1,256,855 | 1,325,644 | 1,418,423 | 1,486,848 | ||||||||||||||||
| Iran | GWh | 247,065 | 258,372 | 264,971 | 272,288 | 289,570 | ||||||||||||||||
| Japan | GWh | 1,044,230 | 1,016,247 | 995,448 | 992,716 | 989,556 | ||||||||||||||||
| Mexico | GWh | 281,548 | 286,083 | 294,393 | 302,900 | 305,103 | ||||||||||||||||
| Russia | GWh | 1,001,775 | 1,005,698 | 1,008,360 | 1,031,318 | 1,034,436 | ||||||||||||||||
| Saudi Arabia | GWh | 284,031 | 316,273 | 337,494 | 345,592 | 355,610 | ... | |||||||||||||||
| South Korea | GWh | 506,706 | 514,217 | 517,743 | 527,174 | 530,549 | ||||||||||||||||
| Turkey | GWh | 228,490 | 238,752 | 249,245 | 261,850 | 283,086 | ||||||||||||||||
| USA | GWh | 4,074,096 | 4,104,839 | 4,091,740 | 4,095,487 | 4,058,261 | ||||||||||||||||
| United Kingdom | GWh | 334,076 | 316,064 | 318,625 | 318,657 | 318,569 |
 Helgi Library


