
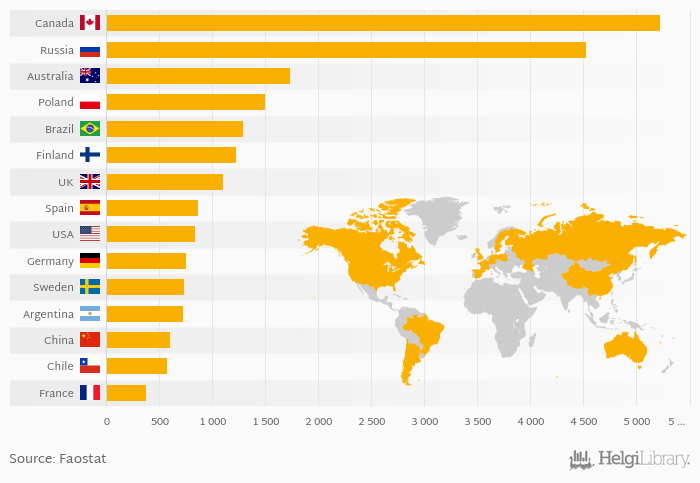
Based on a comparison of 75 countries in 2022, Canada ranked the highest in oat production with 5,226 kt followed by Russia and Australia. On the other end of the scale was Iraq with < 0.001 kt, Syria with 0.003 kt and Ghana with 0.041 kt.
Total oat production reached 26,385 kt in 2022 in the World according to Faostat. This is 14.1 % more than in the previous year and 19.9 % more than 10 years ago.
Historically, total oat production reached an all time high of 54,506 kt in 1971 and an all time low of 19,233 kt in 2010. The average annual growth amounted to -1.03 % since 1961.
The top ranked country, Canada, accounted for 19.8 % of oat production in the world. The top 3 countries hold a 43.6 % share while the ten largest countries some 72.3 % in 2022.
Data for more countries are available at Oat Production indicator page.
| Oat Production | Unit | 2002 | 2003 | 2004 | 2005 | 2006 | 2007 | 2008 | 2009 | 2010 | 2011 | 2012 | 2013 | 2014 | 2015 | 2016 | 2017 | 2018 | 2019 | 2020 | 2021 | 2022 |
| Argentina | kt | 553 | 785 | 492 | 572 | 600 | ||||||||||||||||
| Australia | kt | 1,300 | 2,266 | 1,228 | 1,135 | 1,143 | ||||||||||||||||
| Brazil | kt | 873 | 626 | 899 | 930 | 898 | ||||||||||||||||
| Canada | kt | 3,231 | 3,733 | 3,436 | 4,227 | 4,576 | ||||||||||||||||
| Chile | kt | 533 | 713 | 571 | 385 | 477 | ||||||||||||||||
| China | kt | 530 | 530 | 528 | 529 | 600 | ||||||||||||||||
| Finland | kt | 1,035 | 1,014 | 832 | 1,187 | 1,213 | ||||||||||||||||
| France | kt | 563 | 537 | 423 | 402 | 387 | ||||||||||||||||
| Germany | kt | 536 | 577 | 578 | 519 | 722 | ||||||||||||||||
| Poland | kt | 1,358 | 1,465 | 1,144 | 1,210 | 1,647 | ||||||||||||||||
| Russia | kt | 4,766 | 5,456 | 4,719 | 4,424 | 4,132 | ||||||||||||||||
| Spain | kt | 1,110 | 843 | 1,547 | 841 | 1,378 | ||||||||||||||||
| Sweden | kt | 768 | 676 | 364 | 671 | 808 | ||||||||||||||||
| USA | kt | 938 | 720 | 815 | 773 | 954 | ||||||||||||||||
| United Kingdom | kt | 816 | 875 | 850 | 1,076 | 1,031 |
 Helgi Library


