
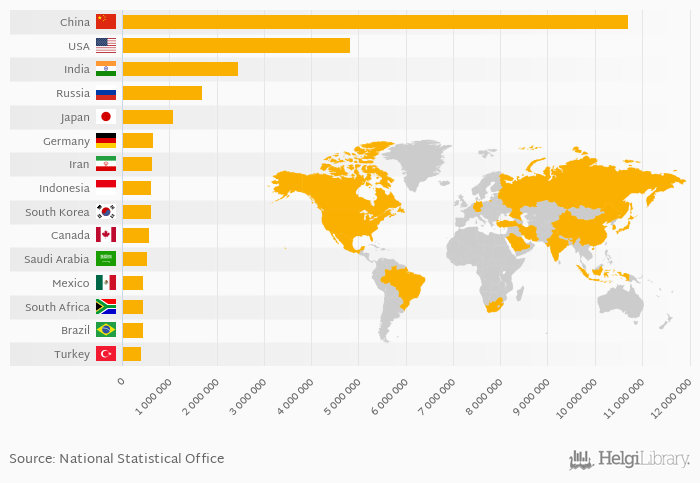
Based on a comparison of 173 countries in 2019, China ranked the highest in CO2 emissions with 10,707,220 kt followed by USA and India. On the other end of the scale was Liechtenstein with 150 kt, Central African Republic with 240 kt and Comoros with 320 kt.
Total CO2 emissions reached 34,344,006 kt in 2019 in the World according to World Bank / EIA. This is 0.159 % more than in the previous year and 14.8 % more than 10 years ago.
Historically, total CO2 emissions reached an all time high of 34,344,006 kt in 2019 and an all time low of 9,423,934 kt in 1961. The average annual growth amounted to 2.21 % since 1960.
The top ranked country, China, accounted for 31.2 % of CO2 emissions in the world. The top 3 countries hold a 52.4 % share while the ten largest countries some 69.5 % in 2019.
Data for more countries are available at CO2 Emissions (Total) indicator page.
| CO2 Emissions (Total) | Unit | 1999 | 2000 | 2001 | 2002 | 2003 | 2004 | 2005 | 2006 | 2007 | 2008 | 2009 | 2010 | 2011 | 2012 | 2013 | 2014 | 2015 | 2016 | 2017 | 2018 | 2019 |
| Brazil | kt | 486,840 | 511,620 | 485,340 | 447,080 | 456,490 | ||||||||||||||||
| Canada | kt | 555,660 | 561,680 | 558,700 | 556,830 | 568,080 | ||||||||||||||||
| China | kt | 9,984,570 | 10,006,670 | 9,861,100 | 9,874,660 | 10,096,010 | ||||||||||||||||
| Germany | kt | 776,150 | 736,010 | 742,310 | 747,150 | 732,200 | ||||||||||||||||
| India | kt | 1,972,430 | 2,147,110 | 2,158,020 | 2,195,250 | 2,320,410 | ||||||||||||||||
| Indonesia | kt | 447,940 | 483,910 | 488,550 | 482,510 | 517,320 | ||||||||||||||||
| Iran | kt | 583,700 | 605,350 | 599,180 | 607,210 | 626,420 | ||||||||||||||||
| Japan | kt | 1,262,780 | 1,217,120 | 1,179,440 | 1,167,790 | 1,155,230 | ||||||||||||||||
| Mexico | kt | 475,740 | 462,240 | 471,630 | 473,310 | 471,580 | ||||||||||||||||
| Russia | kt | 1,632,680 | 1,611,960 | 1,592,560 | 1,571,520 | 1,594,550 | ||||||||||||||||
| Saudi Arabia | kt | 503,210 | 540,520 | 565,190 | 561,230 | 545,070 | ||||||||||||||||
| South Africa | kt | 436,920 | 447,930 | 424,810 | 425,140 | 435,650 | ||||||||||||||||
| South Korea | kt | 599,600 | 588,090 | 607,830 | 615,880 | 626,630 | ||||||||||||||||
| Turkey | kt | 318,170 | 340,640 | 351,590 | 374,590 | 415,900 | ||||||||||||||||
| USA | kt | 5,092,100 | 5,107,210 | 4,990,710 | 4,894,500 | 4,819,370 |
 Helgi Library


