
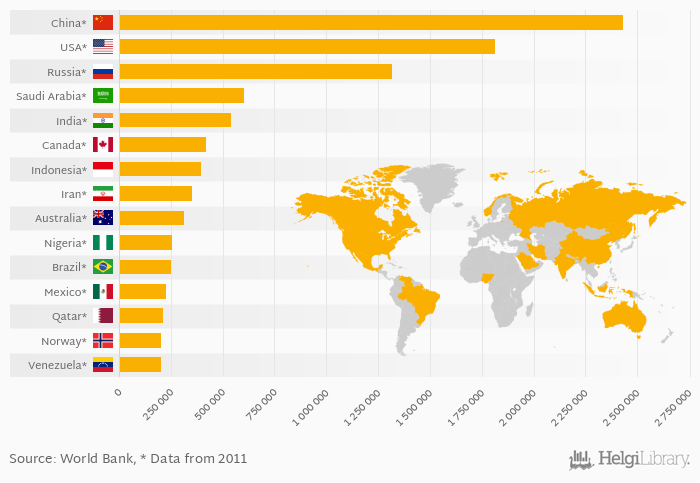
Based on a comparison of 134 countries in 2013, China ranked the highest in energy production measured by kt of oil equivalent with 2,432,505 kt followed by USA and Russia. On the other end of the scale was Malta with 47.9 kt, Hong Kong with 53.0 kt and Cyprus with 95.7 kt.
Data for more countries are available at Energy Production (kt of Oil Equivalent) indicator page.
| Energy Production (kt of Oil Equivalent) | Unit | 1992 | 1993 | 1994 | 1995 | 1996 | 1997 | 1998 | 1999 | 2000 | 2001 | 2002 | 2003 | 2004 | 2005 | 2006 | 2007 | 2008 | 2009 | 2010 | 2011 | 2012 |
| Australia | kt | 266,575 | 282,472 | 282,510 | 290,561 | 308,573 | ||||||||||||||||
| Brazil | kt | 206,325 | 216,425 | 228,192 | 230,609 | 246,630 | ... | |||||||||||||||
| Canada | kt | 410,545 | 416,085 | 405,356 | 390,185 | 395,972 | ||||||||||||||||
| China | kt | 1,813,579 | 1,915,243 | 1,995,443 | 2,092,897 | 2,262,039 | ... | |||||||||||||||
| India | kt | 440,016 | 460,840 | 477,794 | 514,270 | 531,304 | ... | |||||||||||||||
| Indonesia | kt | 313,989 | 318,304 | 323,632 | 351,832 | 381,429 | ... | |||||||||||||||
| Iran | kt | 322,531 | 337,056 | 337,434 | 341,485 | 350,126 | ... | |||||||||||||||
| Mexico | kt | 250,492 | 244,145 | 233,603 | 220,282 | 227,842 | ||||||||||||||||
| Nigeria | kt | 235,810 | 232,537 | 230,207 | 228,078 | 254,779 | ... | |||||||||||||||
| Norway | kt | 215,050 | 214,914 | 218,992 | 214,677 | 203,457 | ||||||||||||||||
| Qatar | kt | 99,400 | 111,659 | 134,459 | 142,464 | 178,345 | ... | |||||||||||||||
| Russia | kt | 1,227,000 | 1,239,129 | 1,253,922 | 1,190,622 | 1,293,049 | ... | |||||||||||||||
| Saudi Arabia | kt | 576,019 | 554,454 | 579,320 | 528,377 | 538,054 | ... | |||||||||||||||
| USA | kt | 1,654,354 | 1,668,955 | 1,701,797 | 1,685,853 | 1,723,409 | ||||||||||||||||
| Venezuela | kt | 228,917 | 203,698 | 204,932 | 199,835 | 198,568 | ... |
 Helgi Library


