
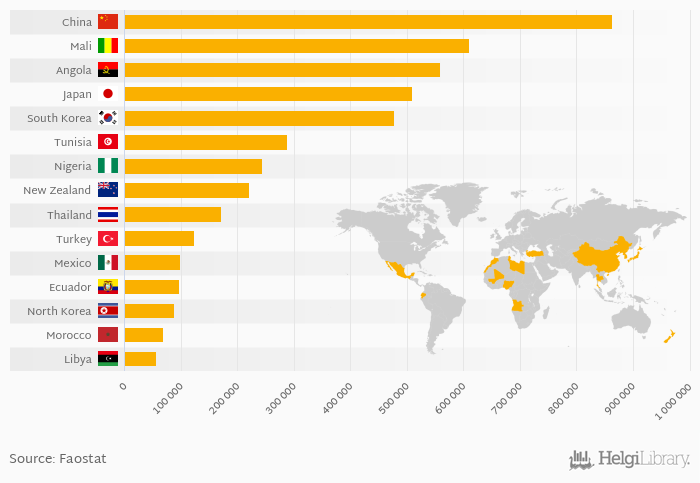
Based on a comparison of 43 countries in 2022, China ranked the highest in onion and shallot production with 864,488 tonnes followed by Mali and Angola. On the other end of the scale was Costa Rica with 94.6 tonnes, Brunei with 101 tonnes and Djibouti with 176 tonnes.
Total onion and shallot production reached 4,970,615 tonnes in 2022 in the World according to Faostat. This is 2.99 % less than in the previous year and 1.40 % more than 10 years ago.
Historically, total onion and shallot production reached an all time high of 5,191,809 tonnes in 2017 and an all time low of 871,594 tonnes in 1961. The average annual growth amounted to 2.90 % since 1961.
The top ranked country, China, accounted for 17.4 % of onion and shallot production in the world. The top 3 countries hold a 40.9 % share while the ten largest countries some 81.9 % in 2022.
Data for more countries are available at Onion (inc. Shallot) Production indicator page.
| Onion (inc. Shallot) Production | Unit | 2002 | 2003 | 2004 | 2005 | 2006 | 2007 | 2008 | 2009 | 2010 | 2011 | 2012 | 2013 | 2014 | 2015 | 2016 | 2017 | 2018 | 2019 | 2020 | 2021 | 2022 |
| Angola | tonnes | 488,830 | 550,722 | 578,836 | 590,387 | 605,998 | ||||||||||||||||
| China | tonnes | 858,957 | 862,356 | 868,493 | 863,269 | 864,706 | ||||||||||||||||
| Dem. People's Republic of Korea | tonnes | 88,076 | 88,147 | 88,582 | 88,665 | 88,196 | ||||||||||||||||
| Ecuador | tonnes | 96,258 | 96,258 | 96,992 | 97,872 | 96,689 | ||||||||||||||||
| Japan | tonnes | 526,900 | 518,400 | 511,400 | 523,600 | 498,100 | ||||||||||||||||
| Libya | tonnes | 56,239 | 56,966 | 53,990 | 54,300 | 57,750 | ||||||||||||||||
| Mali | tonnes | 529,413 | 512,670 | 673,104 | 522,997 | 696,080 | ||||||||||||||||
| Mexico | tonnes | 97,274 | 99,379 | 99,321 | 98,658 | 99,119 | ||||||||||||||||
| Morocco | tonnes | 36,527 | 40,153 | 44,000 | 49,921 | 56,200 | ||||||||||||||||
| New Zealand | tonnes | 271,000 | 269,664 | 258,773 | 266,657 | 251,939 | ||||||||||||||||
| Nigeria | tonnes | 234,068 | 233,832 | 233,681 | 244,743 | 244,444 | ||||||||||||||||
| South Korea | tonnes | 409,859 | 485,116 | 489,864 | 463,721 | 417,881 | ||||||||||||||||
| Thailand | tonnes | 128,538 | 159,954 | 203,500 | 152,299 | 177,281 | ||||||||||||||||
| Tunisia | tonnes | 286,800 | 268,200 | 271,497 | 288,160 | 294,342 | ||||||||||||||||
| Turkey | tonnes | 134,479 | 138,993 | 142,854 | 142,257 | 129,023 |
 Helgi Library


