
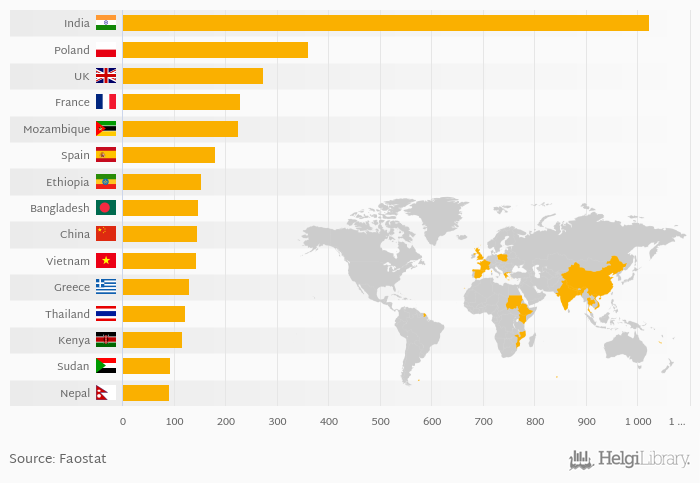
Based on a comparison of 103 countries in 2022, India ranked the highest in pulse production with 1,021 kt followed by Poland and United Kingdom. On the other end of the scale was Bahrain with 0.008 kt, Croatia with 0.020 kt and Suriname with 0.053 kt.
Total pulse production reached 4,905 kt in 2022 in the World according to Faostat. This is 0.184 % less than in the previous year and 17.6 % more than 10 years ago.
Historically, total pulse production reached an all time high of 4,914 kt in 2021 and an all time low of 2,483 kt in 1980. The average annual growth amounted to 0.703 % since 1961.
The top ranked country, India, accounted for 20.8 % of pulse production in the world. The top 3 countries hold a 33.7 % share while the ten largest countries some 58.7 % in 2022.
Data for more countries are available at Pulse Production indicator page.
| Pulse Production | Unit | 2002 | 2003 | 2004 | 2005 | 2006 | 2007 | 2008 | 2009 | 2010 | 2011 | 2012 | 2013 | 2014 | 2015 | 2016 | 2017 | 2018 | 2019 | 2020 | 2021 | 2022 |
| Bangladesh | kt | 122 | 119 | 115 | 129 | 148 | ||||||||||||||||
| China | kt | 139 | 154 | 154 | 143 | 144 | ||||||||||||||||
| Ethiopia | kt | 116 | 120 | 110 | 130 | 132 | ||||||||||||||||
| France | kt | 5.50 | 6.15 | 95.5 | 103 | 208 | ||||||||||||||||
| Greece | kt | 3.00 | 19.2 | 126 | 123 | 137 | ||||||||||||||||
| India | kt | 934 | 914 | 1,000 | 951 | 972 | ||||||||||||||||
| Kenya | kt | 104 | 115 | 124 | 114 | 118 | ||||||||||||||||
| Mozambique | kt | 216 | 217 | 218 | 226 | 222 | ||||||||||||||||
| Nepal | kt | 67.2 | 67.4 | 64.0 | 72.0 | 78.5 | ||||||||||||||||
| Poland | kt | 159 | 312 | 228 | 155 | 277 | ||||||||||||||||
| Spain | kt | 117 | 65.4 | 384 | 213 | 312 | ||||||||||||||||
| Sudan | kt | 89.1 | 90.1 | 90.9 | 92.6 | 92.3 | ||||||||||||||||
| Thailand | kt | 118 | 121 | 124 | 121 | 122 | ||||||||||||||||
| United Kingdom | kt | 270 | 280 | 269 | 273 | 274 | ||||||||||||||||
| Vietnam | kt | 138 | 137 | 136 | 140 | 141 |
 Helgi Library


