
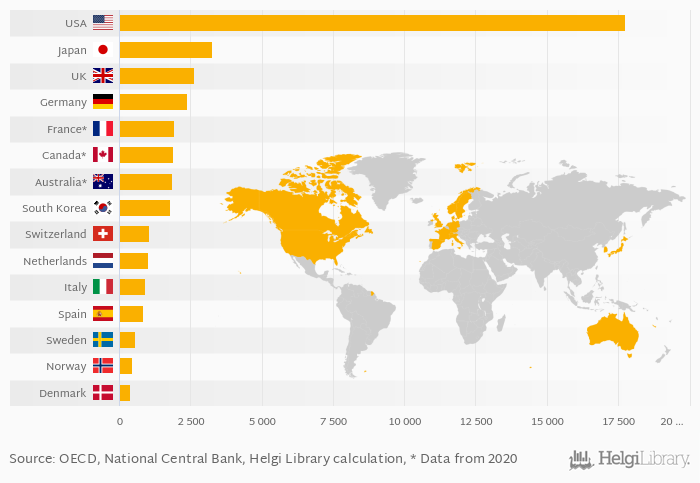
Based on a comparison of 33 countries in 2021, USA ranked the highest in household liabilities with USD 17,737 bil followed by Japan and United Kingdom. On the other end of the scale was Latvia with USD 7.54 bil, Estonia with USD 14.0 bil and Slovenia with USD 16.2 bil.
Data for more countries are available at Total Household Liabilities (USD) indicator page.
| Total Household Liabilities (USD) | Unit | 2001 | 2002 | 2003 | 2004 | 2005 | 2006 | 2007 | 2008 | 2009 | 2010 | 2011 | 2012 | 2013 | 2014 | 2015 | 2016 | 2017 | 2018 | 2019 | 2020 | 2021 |
| Australia | USD bil | 1,435 | 1,513 | 1,726 | 1,633 | 1,664 | ... | |||||||||||||||
| Canada | USD bil | 1,437 | 1,559 | 1,737 | 1,624 | 1,770 | ... | |||||||||||||||
| Denmark | USD bil | 359 | 353 | 401 | 386 | 382 | ||||||||||||||||
| France | USD bil | 1,342 | 1,346 | 1,609 | 1,635 | 1,699 | ... | |||||||||||||||
| Germany | USD bil | 1,767 | 1,765 | 2,072 | 2,029 | 2,082 | ||||||||||||||||
| Italy | USD bil | 754 | 737 | 849 | 827 | 828 | ||||||||||||||||
| Japan | USD bil | 2,658 | 2,788 | 2,953 | 3,083 | 3,197 | ||||||||||||||||
| Netherlands | USD bil | 844 | 828 | 955 | 926 | 919 | ||||||||||||||||
| Norway | USD bil | 338 | 367 | 410 | 409 | 424 | ||||||||||||||||
| South Korea | USD bil | ... | 1,129 | 1,213 | 1,477 | 1,505 | 1,526 | |||||||||||||||
| Spain | USD bil | 798 | 759 | 852 | 812 | 794 | ||||||||||||||||
| Sweden | USD bil | 416 | 418 | 491 | 475 | 481 | ||||||||||||||||
| Switzerland | USD bil | 823 | 825 | 886 | 900 | 936 | ||||||||||||||||
| USA | USD bil | 13,971 | 14,385 | 14,929 | 15,388 | 15,882 | ||||||||||||||||
| United Kingdom | USD bil | 2,461 | 2,123 | 2,414 | 2,335 | 2,462 |
 Helgi Library


