
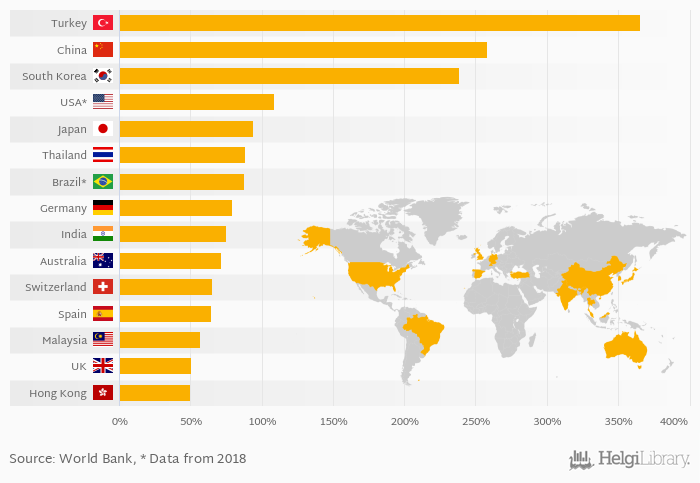
Based on a comparison of 75 countries in 2020, Turkey ranked the highest in stocks traded as a percentage of market capitalisation with 366% followed by China and South Korea. On the other end of the scale was Rwanda with 0.002%, Luxembourg with 0.093% and Cayman Islands with 0.202%.
Average stocks traded as a percentage of market capitalisation reached 112% in 2020 in the World according to OECD. This is 21.3 % more than in the previous year and -15.7 % less than 10 years ago.
Historically, average stocks traded as a percentage of market capitalisation reached an all time high of 250% in 2008 and an all time low of 30.0% in 1982. The average annual growth amounted to 2.42 % since 1975.
Data for more countries are available at Stocks Traded, Turnover Ratio (As % of Market Capitalisation) indicator page.
| Stocks Traded, Turnover Ratio (As % of Market Capitalisation) | Unit | 2000 | 2001 | 2002 | 2003 | 2004 | 2005 | 2006 | 2007 | 2008 | 2009 | 2010 | 2011 | 2012 | 2013 | 2014 | 2015 | 2016 | 2017 | 2018 | 2019 | 2020 |
| Australia | % | 54.6% | 63.2% | 59.8% | 53.6% | 61.3% | ||||||||||||||||
| Brazil | % | 76.3% | 85.6% | 73.6% | 67.0% | 83.9% | ... | |||||||||||||||
| China | % | 199% | 480% | 250% | 198% | 207% | ||||||||||||||||
| Germany | % | 73.0% | 84.2% | 74.9% | 63.6% | 92.1% | ||||||||||||||||
| Hong Kong | % | 44.9% | 65.0% | 40.9% | 43.4% | 59.4% | ||||||||||||||||
| India | % | 45.1% | 46.0% | 46.3% | 47.1% | 56.8% | ||||||||||||||||
| Japan | % | 111% | 114% | 105% | 92.8% | 119% | ||||||||||||||||
| Malaysia | % | 31.1% | 29.1% | 27.0% | 30.1% | 34.0% | ||||||||||||||||
| South Korea | % | 106% | 150% | 126% | 112% | 174% | ||||||||||||||||
| Spain | % | 99.9% | 124% | 97.8% | 82.6% | 86.2% | ||||||||||||||||
| Switzerland | % | 49.1% | 62.9% | 60.7% | 55.4% | 65.1% | ||||||||||||||||
| Thailand | % | 72.2% | 77.8% | 80.9% | 61.9% | 77.2% | ||||||||||||||||
| Turkey | % | 168% | 185% | 169% | 166% | 248% | ||||||||||||||||
| USA | % | 148% | 165% | 94.7% | 116% | 109% | ... | ... | ||||||||||||||
| United Kingdom | % | 66.0% | ... | ... | ... | ... | ... |
 Helgi Library


