
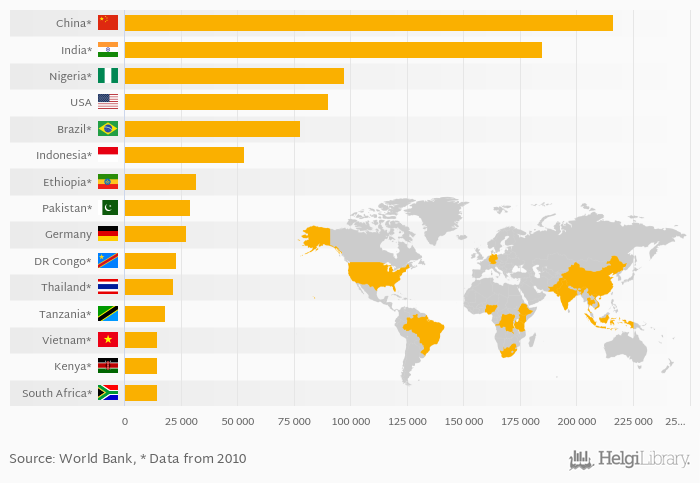
Based on a comparison of 128 countries in 2012, China ranked the highest in combustible renewables & waste in metric tons of oil equivalent with 216,423 tonnes followed by India and Nigeria. On the other end of the scale was Iceland with 1.15 tonnes, Kyrgyzstan with 3.77 tonnes and Uzbekistan with 3.77 tonnes.
Data for more countries are available at Combustible Renewables & Waste (metric tons of Oil Equivalent) indicator page.
| Combustible Renewables & Waste (metric tons of Oil Equivalent) | Unit | 1992 | 1993 | 1994 | 1995 | 1996 | 1997 | 1998 | 1999 | 2000 | 2001 | 2002 | 2003 | 2004 | 2005 | 2006 | 2007 | 2008 | 2009 | 2010 | 2011 | 2012 |
| Brazil | tonnes | 66,377 | 72,177 | 78,449 | 76,097 | 81,618 | ... | |||||||||||||||
| China | tonnes | 202,995 | 203,760 | 202,383 | 209,912 | 213,621 | ... | |||||||||||||||
| Dem. Republic of the Congo | tonnes | 19,429 | 20,087 | 20,768 | 21,472 | 22,200 | ... | |||||||||||||||
| Ethiopia | tonnes | 27,838 | 28,469 | 29,286 | 30,126 | 30,992 | ... | |||||||||||||||
| Germany | tonnes | 15,781 | 22,761 | 22,902 | 24,778 | 29,409 | ||||||||||||||||
| India | tonnes | 161,498 | 169,293 | 171,970 | 176,153 | 180,088 | ... | |||||||||||||||
| Indonesia | tonnes | 51,548 | 51,589 | 52,188 | 52,520 | 54,041 | ... | |||||||||||||||
| Kenya | tonnes | 12,847 | 13,176 | 13,515 | 13,866 | 14,233 | ... | |||||||||||||||
| Nigeria | tonnes | 85,803 | 87,965 | 90,189 | 92,476 | 94,832 | ... | |||||||||||||||
| Pakistan | tonnes | 26,825 | 27,313 | 27,810 | 28,317 | 28,832 | ... | |||||||||||||||
| South Africa | tonnes | 13,706 | 13,857 | 14,011 | 14,162 | 14,355 | ... | |||||||||||||||
| Tanzania | tonnes | 15,780 | 16,241 | 16,733 | 17,223 | 17,757 | ... | |||||||||||||||
| Thailand | tonnes | 17,535 | 18,828 | 20,252 | 20,699 | 22,605 | ... | |||||||||||||||
| USA | tonnes | 78,347 | 80,676 | 84,488 | 83,802 | 89,304 | ||||||||||||||||
| Vietnam | tonnes | 14,764 | 14,745 | 14,723 | 14,719 | 14,707 | ... | ... |
 Helgi Library


