
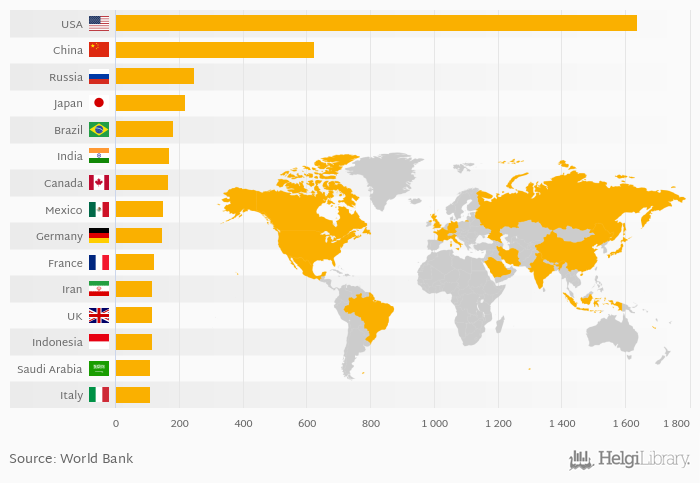
Based on a comparison of 135 countries in 2011, USA ranked the highest in CO2 emissions from transport with 1,638 Mt followed by China and Russia. On the other end of the scale was Eritrea with 0.150 Mt, Tajikistan with 0.310 Mt and Tanzania with 0.310 Mt.
Total CO2 emissions from transport reached 5,887 Mt in 2011 in the World according to World Bank / EIA. This is 1.3 % more than in the previous year and 15.9 % more than 10 years ago.
Historically, total CO2 emissions from transport reached an all time high of 5,887 Mt in 2011 and an all time low of 2,419 Mt in 1971. The average annual growth amounted to 2.25 % since 1960.
The top ranked country, USA, accounted for 27.8 % of CO2 emissions from transport in the world. The top 3 countries hold a 42.6 % share while the ten largest countries some 62.3 % in 2011.
Data for more countries are available at CO2 Emissions from Transport indicator page.
| CO2 Emissions from Transport | Unit | 1991 | 1992 | 1993 | 1994 | 1995 | 1996 | 1997 | 1998 | 1999 | 2000 | 2001 | 2002 | 2003 | 2004 | 2005 | 2006 | 2007 | 2008 | 2009 | 2010 | 2011 |
| Brazil | Mt | 136 | 139 | 144 | 150 | 147 | ||||||||||||||||
| Canada | Mt | 160 | 159 | 164 | 161 | 164 | ||||||||||||||||
| China | Mt | 383 | 419 | 454 | 470 | 492 | ||||||||||||||||
| France | Mt | 132 | 131 | 131 | 125 | 123 | ||||||||||||||||
| Germany | Mt | 155 | 152 | 148 | 147 | 147 | ||||||||||||||||
| India | Mt | 101 | 111 | 122 | 135 | 149 | ||||||||||||||||
| Indonesia | Mt | 73.9 | 70.3 | 74.0 | 81.5 | 93.4 | ||||||||||||||||
| Iran | Mt | 104 | 110 | 109 | 114 | 124 | ||||||||||||||||
| Italy | Mt | 122 | 124 | 124 | 117 | 111 | ||||||||||||||||
| Japan | Mt | 245 | 242 | 236 | 226 | 221 | ||||||||||||||||
| Mexico | Mt | 130 | 137 | 145 | 151 | 147 | ||||||||||||||||
| Russia | Mt | 219 | 227 | 229 | 243 | 226 | ||||||||||||||||
| Saudi Arabia | Mt | 75.0 | 81.0 | 90.4 | 97.6 | 101 | ||||||||||||||||
| USA | Mt | 1,790 | 1,788 | 1,789 | 1,691 | 1,607 | ||||||||||||||||
| United Kingdom | Mt | 126 | 128 | 129 | 124 | 119 |
 Helgi Library


