
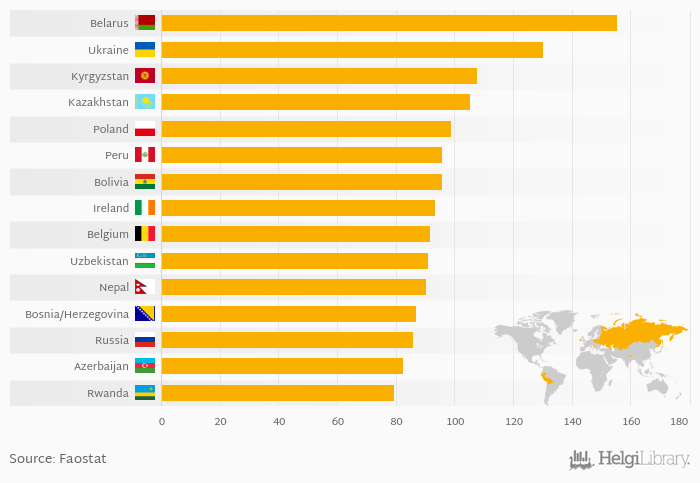
Based on a comparison of 165 countries in 2021, Belarus ranked the highest in potato consumption per capita with 155 kg followed by Ukraine and Kyrgyzstan. On the other end of the scale was South Sudan with 0.130 kg, Central African Republic with 0.150 kg and Sierra Leone with 0.310 kg.
Average potato consumption per capita reached 33.0 kg in 2021 in the World according to Faostat. This is 0.455 % less than in the previous year and -3.40 % less than 10 years ago.
Historically, average potato consumption per capita reached an all time high of 35.7 kg in 1961 and an all time low of 26.0 kg in 1991. The average annual growth amounted to -0.132 % since 1961.
Data for more countries are available at Potato Consumption Per Capita indicator page.
| Potato Consumption Per Capita | Unit | 2001 | 2002 | 2003 | 2004 | 2005 | 2006 | 2007 | 2008 | 2009 | 2010 | 2011 | 2012 | 2013 | 2014 | 2015 | 2016 | 2017 | 2018 | 2019 | 2020 | 2021 |
| Azerbaijan | kg | 69.4 | 72.6 | 73.0 | 71.4 | 80.1 | ||||||||||||||||
| Belarus | kg | 169 | 169 | 170 | 168 | 172 | ||||||||||||||||
| Belgium | kg | 91.9 | 88.3 | 89.2 | 86.1 | 89.8 | ||||||||||||||||
| Bolivia | kg | 68.4 | 68.7 | 69.1 | 69.5 | 94.5 | ||||||||||||||||
| Bosnia and Herzegovina | kg | 79.7 | 92.1 | 87.3 | 91.4 | 87.4 | ||||||||||||||||
| Ireland | kg | 85.9 | 83.3 | 82.4 | 81.7 | 83.9 | ||||||||||||||||
| Kazakhstan | kg | 109 | 109 | 106 | 110 | 110 | ||||||||||||||||
| Kyrgyzstan | kg | 96.1 | 95.9 | 95.6 | 95.5 | 122 | ||||||||||||||||
| Nepal | kg | 80.4 | 81.7 | 83.4 | 84.8 | 87.2 | ||||||||||||||||
| Peru | kg | 88.8 | 85.8 | 90.3 | 90.4 | 91.7 | ||||||||||||||||
| Poland | kg | 98.5 | 101 | 101 | 98.4 | 98.8 | ||||||||||||||||
| Russia | kg | 114 | 96.8 | 91.1 | 95.6 | 90.5 | ||||||||||||||||
| Rwanda | kg | 100 | 103 | 92.2 | 95.6 | 89.8 | ||||||||||||||||
| Ukraine | kg | 116 | 131 | 139 | 132 | 130 | ||||||||||||||||
| Uzbekistan | kg | 75.9 | 78.2 | 80.3 | 83.5 | 86.1 |
 Helgi Library


