
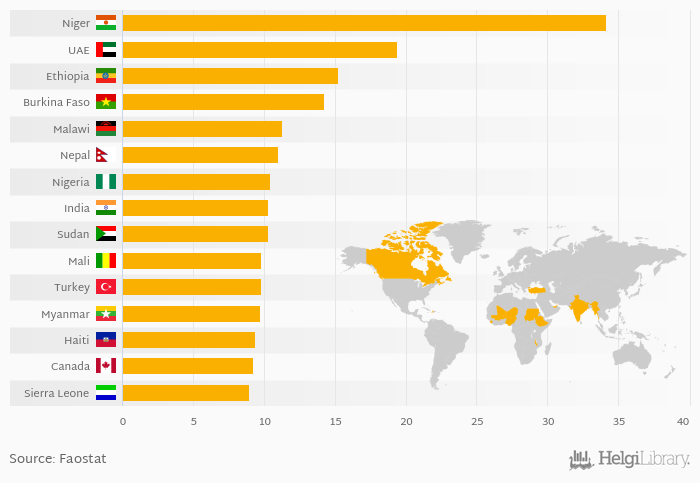
Based on a comparison of 128 countries in 2017, Niger ranked the highest in pulse consumption per capita with 34.1 kg followed by United Arab Emirates and Ethiopia. On the other end of the scale was Uzbekistan with 0.031 kg, Romania with 0.051 kg and Poland with 0.053 kg.
Average pulse consumption per capita reached 3.94 kg in 2017 in the World according to Faostat. This is 7.85 % more than in the previous year and 17.8 % more than 10 years ago.
Historically, average pulse consumption per capita reached an all time high of 4.79 kg in 1961 and an all time low of 2.64 kg in 1992. The average annual growth amounted to -0.348 % since 1961.
Data for more countries are available at Pulse Consumption Per Capita indicator page.
| Pulse Consumption Per Capita | Unit | 2001 | 2002 | 2003 | 2004 | 2005 | 2006 | 2007 | 2008 | 2009 | 2010 | 2011 | 2012 | 2013 | 2014 | 2015 | 2016 | 2017 | 2018 | 2019 | 2020 | 2021 |
| Burkina Faso | kg | 17,203 | 17,276 | 16,485 | 17,408 | 34,985 | ||||||||||||||||
| Canada | kg | 3,361 | 9,222 | 11,110 | 8,822 | 7,500 | ||||||||||||||||
| Ethiopia | kg | 15,526 | 15,063 | 15,518 | 15,216 | 14,800 | ||||||||||||||||
| Haiti | kg | 9,372 | 7,934 | 7,180 | 5,267 | 7,258 | ||||||||||||||||
| India | kg | 9,618 | 8,490 | 10,333 | 9,851 | 9,969 | ||||||||||||||||
| Malawi | kg | 10,390 | 13,444 | 10,514 | 10,507 | 12,190 | ||||||||||||||||
| Mali | kg | 9,606 | 8,823 | 7,560 | 8,679 | 6,661 | ||||||||||||||||
| Myanmar | kg | 10,528 | 10,368 | 10,174 | 9,722 | 10,709 | ||||||||||||||||
| Nepal | kg | 11,336 | 11,737 | 12,561 | 12,453 | 12,833 | ||||||||||||||||
| Niger | kg | 37,857 | 37,903 | 37,492 | 38,490 | 42,144 | ||||||||||||||||
| Nigeria | kg | 9,446 | 9,376 | 10,905 | 10,656 | 10,811 | ||||||||||||||||
| Sierra Leone | kg | 9,023 | 9,074 | 9,117 | 9,032 | 8,326 | ||||||||||||||||
| Sudan | kg | ... | ... | ... | ... | ... | ... | ... | ... | ... | ... | ... | 9,379 | 8,203 | 9,341 | 9,453 | 9,808 | |||||
| Turkey | kg | 9,931 | 9,195 | 9,758 | 9,926 | 9,535 | ||||||||||||||||
| United Arab Emirates | kg | 12,897 | 12,452 | 13,123 | 10,612 | 12,810 |
 Helgi Library


