

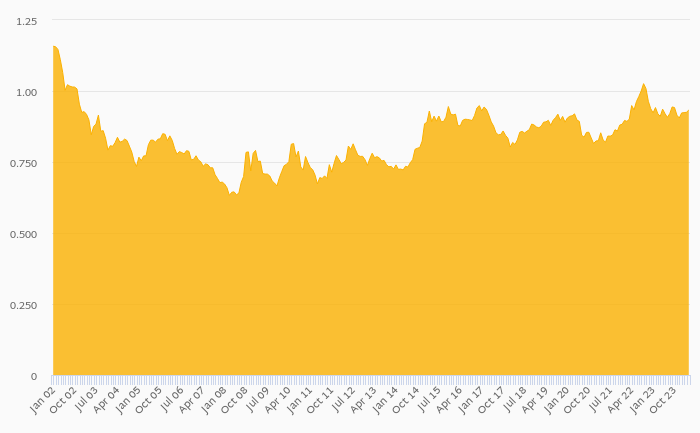
Production of green chilli and pepper rose 10.8% to 120 kt in Saudi Arabia in 2022, according to Faostat.
Historically, production of green chilli and pepper in Saudi Arabia reached an all time high of 120 kt in 2022 and an all time low of 24.5 kt in 2019. When compared to Saudi Arabia's main peers, production of green chilli and pepper in Iraq amounted to 43.9 kt, 100 kt in Jordan, 5.94 kt in United Arab Emirates and 18.2 kt in Yemen in 2022.
Saudi Arabia has been ranked 26th within the group of 117 countries we follow in terms of production of green chilli and pepper, 26 places below the position seen 10 years ago.
| Production of Chilli and Pepper (Green) | Unit | 2002 | 2003 | 2004 | 2005 | 2006 | 2007 | 2008 | 2009 | 2010 | 2011 | 2012 | 2013 | 2014 | 2015 | 2016 | 2017 | 2018 | 2019 | 2020 | 2021 | 2022 |
| Bahrain | kt | 0.674 | 0.890 | 0.940 | 0.951 | 0.960 | ||||||||||||||||
| Djibouti | kt | 0.012 | 0.012 | 0.011 | 0.015 | 0.016 | ||||||||||||||||
| Eritrea | kt | ... | ... | ... | ... | ... | ... | ... | ... | ... | ... | ... | ... | ... | ... | ... | ... | ... | ... | ... | ... | ... |
| Iran | kt | 92.3 | 95.8 | 92.9 | 93.7 | 94.1 | ||||||||||||||||
| Iraq | kt | 16.2 | 13.2 | 23.5 | 23.1 | 46.5 | ||||||||||||||||
| Israel | kt | 189 | 172 | 196 | 171 | 147 | ||||||||||||||||
| Jordan | kt | 100 | 68.6 | 80.1 | 65.8 | 95.3 | ||||||||||||||||
| Kuwait | kt | 12.0 | 14.1 | 11.5 | 19.0 | 7.51 | ||||||||||||||||
| Oman | kt | 10.9 | 66.0 | 64.7 | 65.3 | 92.8 | ||||||||||||||||
| Qatar | kt | 1.23 | 1.26 | 1.80 | 2.39 | 3.36 | ||||||||||||||||
| Saudi Arabia | kt | ... | ... | ... | ... | ... | ... | ... | ... | ... | ... | ... | ... | ... | ... | ... | 47.9 | 52.1 | 24.5 | 94.8 | ||
| Syria | kt | 76.4 | 86.9 | 77.9 | 52.4 | 77.7 | ||||||||||||||||
| United Arab Emirates | kt | 5.45 | 5.57 | 4.15 | 5.18 | 6.38 | ||||||||||||||||
| Yemen | kt | 16.1 | 16.0 | 13.6 | 15.4 | 15.6 |


 Helgi Library