Follow us for the latest automotive news.
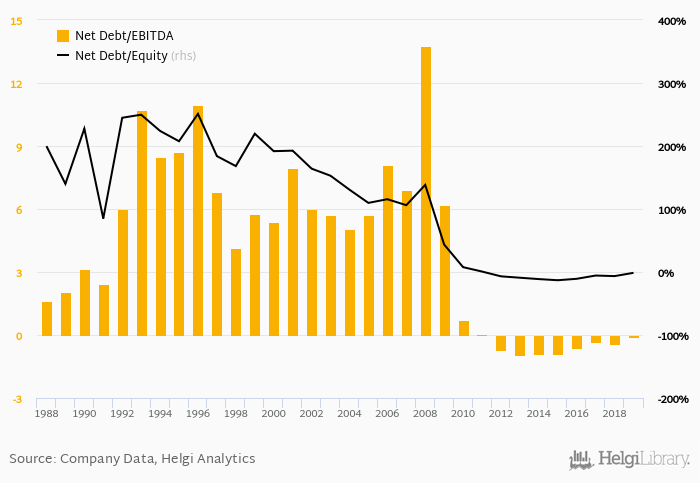
Renault's net debt stood at EUR -470 mil and accounted for -1.33% of equity at the end of 2019. The ratio is up 5.21 pp compared to the previous year.
Historically, the firm’s net debt to equity reached a high of 251% in 1996 and a low of -13.1% in 2015 between 1988 and 2019. The average for the last five years was -7.48%.
Net debt to EBITDA was calculated at -0.104x at the end of the year. That is down from -0.886x seen in 2014. The ratio reached a high of 13.8x in 2008 and a low of -0.935x in 2013.
The company’s cost of funding amounted to 0.693% in 2019, down which is above the 5-year of 0.854%. Funding costs have “eaten” some 18.3% of the operating profit generated in 2019.
You can see all the company’s data at Renault profile, or you can download a report on the company in the report section.
 Helgi Library