By Helgi Library - May 10, 2022
Chipotle Mexican Grill made a net profit of USD 653 mil with revenues of USD 7,547 mil in 2021, up by 83.5% and up by 2...
By Helgi Library - May 10, 2022
Chipotle Mexican Grill made a net profit of USD 653 mil in 2021, up 83.5% compared to the previous year. Total sales reached USD 7,5...
By Helgi Library - May 10, 2022
Chipotle Mexican Grill stock traded at USD 1,748 per share at the end 2021 translating into a market capitalization of USD 49,091 mil. ...
| Profit Statement | 2025 | 2026 | 2027 | |
| Sales | USD mil | 13,065 | 14,896 | 16,575 |
| Gross Profit | USD mil | 3,618 | 4,323 | 4,871 |
| EBITDA | USD mil | 2,811 | 3,439 | 3,839 |
| EBIT | USD mil | 2,435 | 3,010 | 3,350 |
| Financing Cost | USD mil | ... | ... | ... |
| Pre-Tax Profit | USD mil | 2,382 | 2,989 | 3,372 |
| Net Profit | USD mil | 1,778 | 2,229 | 2,530 |
| Dividends | USD mil | 0 | 0 | 0 |
| Balance Sheet | 2025 | 2026 | 2027 | |
| Total Assets | USD mil | 8,899 | 9,395 | 9,909 |
| Non-Current Assets | USD mil | 6,848 | 7,175 | 7,519 |
| Current Assets | USD mil | 2,050 | 2,220 | 2,391 |
| Working Capital | USD mil | -34.2 | -35.1 | -35.9 |
| Shareholders' Equity | USD mil | 6,381 | 8,053 | 9,954 |
| Liabilities | USD mil | 2,518 | 1,342 | -44.7 |
| Total Debt | USD mil | 3,560 | 3,570 | 3,580 |
| Net Debt | USD mil | 1,610 | 1,470 | 1,330 |
| Ratios | 2025 | 2026 | 2027 | |
| ROE | % | 34.3 | 30.9 | 28.1 |
| ROCE | % | 27.0 | 31.9 | 34.6 |
| Gross Margin | % | 27.7 | 29.0 | 29.4 |
| EBITDA Margin | % | 21.5 | 23.1 | 23.2 |
| EBIT Margin | % | 18.6 | 20.2 | 20.2 |
| Net Margin | % | 13.6 | 15.0 | 15.3 |
| Net Debt/EBITDA | 0.573 | 0.427 | 0.346 | |
| Net Debt/Equity | % | 25.2 | 18.2 | 13.4 |
| Cost of Financing | % | ... | ... | ... |
| Valuation | 2025 | 2026 | 2027 | |
| Market Capitalisation | USD mil | 37,863 | 37,863 | 37,863 |
| Enterprise Value (EV) | USD mil | 39,473 | 39,333 | 39,193 |
| Number Of Shares | mil | 28.5 | 28.5 | 28.5 |
| Share Price | USD | 1,328 | 1,328 | 1,328 |
| EV/EBITDA | 14.0 | 11.4 | 10.2 | |
| EV/Sales | 3.02 | 2.64 | 2.36 | |
| Price/Earnings (P/E) | 21.3 | 17.0 | 15.0 | |
| Price/Book Value (P/BV) | 5.93 | 4.70 | 3.80 | |
| Dividend Yield | % | 0 | 0 | 0 |
Get all company financials in excel:
| overview | Unit | 2011 | 2012 | 2013 | 2014 | 2015 | 2016 | 2017 | 2018 | 2019 | 2020 | 2021 | 2022 | 2023 | 2024 | 2025 | 2026 | 2027 |
| income statement | ||||||||||||||||||
| Sales | USD mil | 4,476 | 4,865 | 5,586 | 5,985 | 7,547 | ||||||||||||
| Gross Profit | USD mil | 756 | 911 | 1,142 | 1,041 | 1,707 | ||||||||||||
| EBIT | USD mil | 271 | 258 | 444 | 290 | 805 | ||||||||||||
| Net Profit | USD mil | 176 | 177 | 350 | 356 | 653 | ||||||||||||
| ROE | % | ... | 12.7 | 12.6 | 22.4 | 19.2 | 30.2 | |||||||||||
| EBIT Margin | % | 6.05 | 5.31 | 7.95 | 4.85 | 10.7 | ||||||||||||
| Net Margin | % | 3.94 | 3.63 | 6.27 | 5.94 | 8.65 | ||||||||||||
| Employees | 68,890 | 73,000 | 83,000 | 88,000 | 97,660 | ... | ... | ... | ... | ... | ... | |||||||
| balance sheet | ||||||||||||||||||
| Total Assets | USD mil | 2,046 | 2,266 | 5,105 | 5,983 | 6,653 | ||||||||||||
| Non-Current Assets | USD mil | 1,416 | 1,451 | 4,032 | 4,563 | 5,271 | ||||||||||||
| Current Assets | USD mil | 630 | 815 | 1,072 | 1,420 | 1,382 | ||||||||||||
| Shareholders' Equity | USD mil | 1,364 | 1,441 | 1,683 | 2,020 | 2,297 | ||||||||||||
| Liabilities | USD mil | 681 | 824 | 3,422 | 3,963 | 4,356 | ||||||||||||
| Non-Current Liabilities | USD mil | 357 | 374 | 2,755 | 3,141 | 3,482 | ||||||||||||
| Current Liabilities | USD mil | 324 | 450 | 667 | 822 | 874 | ||||||||||||
| Net Debt/EBITDA | -1.17 | -1.47 | 2.05 | 2.57 | 1.72 | |||||||||||||
| Net Debt/Equity | % | -37.1 | -46.8 | 117 | 109 | 106 | ||||||||||||
| Cost of Financing | % | ... | ... | ... | ... | ... | ... | ... | ... | ... | ... | ... | ... | ... | ... | ... | ||
| cash flow | ||||||||||||||||||
| Total Cash From Operations | USD mil | 468 | 622 | 722 | 664 | 1,282 | ||||||||||||
| Total Cash From Investing | USD mil | -86.6 | -388 | -292 | -433 | -522 | ||||||||||||
| Total Cash From Financing | USD mil | -286 | -167 | -202 | -105 | -549 | ||||||||||||
| Net Change In Cash | USD mil | 97.8 | 66.0 | 228 | 127 | 210 | ||||||||||||
| valuation | ||||||||||||||||||
| Market Capitalisation | USD mil | ... | ... | ... | ... | ... | ... | 8,100 | 11,959 | 23,234 | 38,829 | 49,091 | ||||||
| Enterprise Value (EV) | USD mil | ... | ... | ... | ... | ... | ... | 7,594 | 11,285 | 25,207 | 41,035 | 51,535 | ||||||
| Number Of Shares | mil | ... | ... | ... | ... | ... | ... | 28.6 | 28.0 | 28.3 | 28.4 | 28.5 | ||||||
| Share Price | USD | ... | ... | ... | ... | ... | ... | 289 | 432 | 837 | 1,387 | 1,748 | ||||||
| Price/Earnings (P/E) | ... | ... | ... | ... | ... | ... | 46.8 | 68.4 | 67.6 | 111 | 76.3 | |||||||
| Price/Cash Earnings (P/CE) | ... | ... | ... | ... | ... | ... | ... | ... | ... | ... | ... | |||||||
| EV/EBITDA | ... | ... | ... | ... | ... | ... | 17.5 | 24.5 | 26.2 | 47.8 | 36.3 | |||||||
| Price/Book Value (P/BV) | ... | ... | ... | ... | ... | ... | 6.05 | 8.38 | 14.1 | 19.5 | 21.7 | |||||||
| Dividend Yield | % | ... | ... | ... | ... | ... | ... | 0 | 0 | 0 | 0 | 0 |
| income statement | Unit | 2011 | 2012 | 2013 | 2014 | 2015 | 2016 | 2017 | 2018 | 2019 | 2020 | 2021 | 2022 | 2023 | 2024 | 2025 | 2026 | 2027 |
| income statement | ||||||||||||||||||
| Sales | USD mil | 4,476 | 4,865 | 5,586 | 5,985 | 7,547 | ||||||||||||
| Cost of Goods & Services | USD mil | 3,720 | 3,954 | 4,444 | 4,944 | 5,840 | ||||||||||||
| Gross Profit | USD mil | 756 | 911 | 1,142 | 1,041 | 1,707 | ||||||||||||
| Selling, General & Admin | USD mil | 403 | 487 | 620 | 689 | 829 | ... | ... | ... | ... | ... | ... | ||||||
| Research & Development | USD mil | 0 | 0 | 0 | 0 | 0 | ... | ... | ... | ... | ... | ... | ||||||
| Other Operating Expense | USD mil | -80.7 | -36.5 | -135 | -177 | -182 | ... | ... | ... | ... | ... | ... | ||||||
| Other Operating Cost (Income) | USD mil | 0 | 0 | 0 | 0 | 0 | ... | ... | ... | ... | ... | ... | ||||||
| EBITDA | USD mil | 434 | 460 | 962 | 859 | 1,419 | ||||||||||||
| Depreciation | USD mil | ... | ... | ... | ... | ... | ... | ... | ... | ... | ... | ... | ||||||
| EBIT | USD mil | 271 | 258 | 444 | 290 | 805 | ||||||||||||
| Net Financing Cost | USD mil | -4.95 | -10.1 | -14.3 | -3.62 | -7.82 | ||||||||||||
| Financing Cost | USD mil | ... | ... | ... | ... | ... | ... | ... | ... | ... | ... | ... | ... | ... | ... | ... | ||
| Financing Income | USD mil | ... | ... | ... | ... | ... | 4.95 | ... | ... | ... | ... | ... | ... | ... | ... | ... | ... | |
| FX (Gain) Loss | USD mil | 0 | 0 | 0 | 0 | 0 | ... | ... | ... | ... | ... | ... | ||||||
| Extraordinary Cost | USD mil | 0 | 0 | 0 | 0 | 0 | ... | ... | ... | ... | ... | ... | ||||||
| Pre-Tax Profit | USD mil | 276 | 268 | 458 | 294 | 813 | ||||||||||||
| Tax | USD mil | 99.5 | 91.9 | 108 | -62.0 | 160 | ||||||||||||
| Minorities | USD mil | 0 | 0 | 0 | 0 | 0 | ||||||||||||
| Net Profit | USD mil | 176 | 177 | 350 | 356 | 653 | ||||||||||||
| Net Profit Avail. to Common | USD mil | 176 | 177 | 350 | 356 | 653 | ||||||||||||
| Dividends | USD mil | 0 | 0 | 0 | 0 | 0 | ||||||||||||
| growth rates | ||||||||||||||||||
| Total Revenue Growth | % | ... | 14.7 | 8.68 | 14.8 | 7.13 | 26.1 | |||||||||||
| Operating Cost Growth | % | ... | 4.70 | 34.4 | 7.03 | 7.50 | 20.1 | ... | ... | ... | ... | ... | ... | |||||
| EBITDA Growth | % | ... | 140 | 6.04 | 109 | -10.7 | 65.2 | |||||||||||
| EBIT Growth | % | ... | 683 | -4.59 | 71.8 | -34.6 | 177 | |||||||||||
| Pre-Tax Profit Growth | % | ... | 612 | -2.65 | 70.7 | -35.9 | 177 | |||||||||||
| Net Profit Growth | % | ... | 668 | 0.170 | 98.3 | 1.60 | 83.5 | |||||||||||
| ratios | ||||||||||||||||||
| ROE | % | ... | 12.7 | 12.6 | 22.4 | 19.2 | 30.2 | |||||||||||
| ROA | % | ... | 8.66 | 8.19 | 9.50 | 6.42 | 10.3 | |||||||||||
| ROCE | % | ... | 12.3 | 12.5 | 12.9 | 8.28 | 13.3 | |||||||||||
| Gross Margin | % | 16.9 | 18.7 | 20.5 | 17.4 | 22.6 | ||||||||||||
| EBITDA Margin | % | 9.70 | 9.46 | 17.2 | 14.4 | 18.8 | ||||||||||||
| EBIT Margin | % | 6.05 | 5.31 | 7.95 | 4.85 | 10.7 | ||||||||||||
| Net Margin | % | 3.94 | 3.63 | 6.27 | 5.94 | 8.65 | ||||||||||||
| Payout Ratio | % | 0 | 0 | 0 | 0 | 0 | ||||||||||||
| Cost of Financing | % | ... | ... | ... | ... | ... | ... | ... | ... | ... | ... | ... | ... | ... | ... | ... | ||
| Net Debt/EBITDA | -1.17 | -1.47 | 2.05 | 2.57 | 1.72 |
| balance sheet | Unit | 2011 | 2012 | 2013 | 2014 | 2015 | 2016 | 2017 | 2018 | 2019 | 2020 | 2021 | 2022 | 2023 | 2024 | 2025 | 2026 | 2027 |
| balance sheet | ||||||||||||||||||
| Cash & Cash Equivalents | USD mil | 509 | 677 | 881 | 952 | 1,076 | ||||||||||||
| Receivables | USD mil | 40.5 | 62.3 | 80.5 | 105 | 99.6 | ||||||||||||
| Inventories | USD mil | 19.9 | 21.6 | 26.1 | 26.4 | 32.8 | ||||||||||||
| Other ST Assets | USD mil | 60.3 | 54.1 | 84.8 | 338 | 173 | ||||||||||||
| Current Assets | USD mil | 630 | 815 | 1,072 | 1,420 | 1,382 | ||||||||||||
| Property, Plant & Equipment | USD mil | 1,338 | 1,379 | 3,964 | 4,352 | 4,888 | ||||||||||||
| LT Investments & Receivables | USD mil | 0 | 0 | 0 | 102 | 274 | ||||||||||||
| Intangible Assets | USD mil | 21.9 | 21.9 | 21.9 | 21.9 | 21.9 | ||||||||||||
| Goodwill | USD mil | 21.9 | 21.9 | 21.9 | 21.9 | 21.9 | ||||||||||||
| Non-Current Assets | USD mil | 1,416 | 1,451 | 4,032 | 4,563 | 5,271 | ||||||||||||
| Total Assets | USD mil | 2,046 | 2,266 | 5,105 | 5,983 | 6,653 | ||||||||||||
| Trade Payables | USD mil | 82.0 | 113 | 116 | 122 | 163 | ||||||||||||
| Short-Term Debt | USD mil | 0 | 0 | 173 | 205 | 219 | ||||||||||||
| Other ST Liabilities | USD mil | 0 | 70.5 | 95.2 | 128 | 156 | ||||||||||||
| Current Liabilities | USD mil | 324 | 450 | 667 | 822 | 874 | ||||||||||||
| Long-Term Debt | USD mil | 2.63 | 2.39 | 2,681 | 2,952 | 3,302 | ||||||||||||
| Other LT Liabilities | USD mil | 355 | 372 | 74.2 | 188 | 180 | ||||||||||||
| Non-Current Liabilities | USD mil | 357 | 374 | 2,755 | 3,141 | 3,482 | ||||||||||||
| Liabilities | USD mil | 681 | 824 | 3,422 | 3,963 | 4,356 | ||||||||||||
| Preferred Equity and Hybrid Capital | USD mil | 0 | 0 | 0 | 0 | 0 | ||||||||||||
| Share Capital | USD mil | 1,305 | 1,375 | 1,466 | 1,550 | 1,730 | ||||||||||||
| Treasury Stock | USD mil | 2,334 | 2,501 | 2,699 | 2,802 | 3,356 | ||||||||||||
| Equity Before Minority Interest | USD mil | 1,364 | 1,441 | 1,683 | 2,020 | 2,297 | ||||||||||||
| Minority Interest | USD mil | 0 | 0 | 0 | 0 | 0 | ||||||||||||
| Equity | USD mil | 1,364 | 1,441 | 1,683 | 2,020 | 2,297 | ||||||||||||
| growth rates | ||||||||||||||||||
| Total Asset Growth | % | ... | 0.967 | 10.7 | 125 | 17.2 | 11.2 | |||||||||||
| Shareholders' Equity Growth | % | ... | -2.71 | 5.64 | 16.8 | 20.0 | 13.7 | |||||||||||
| Net Debt Growth | % | ... | 22.0 | 33.2 | -393 | 11.8 | 10.8 | |||||||||||
| Total Debt Growth | % | ... | -7.85 | -9.13 | 119,310 | 10.6 | 11.5 | |||||||||||
| ratios | ||||||||||||||||||
| Total Debt | USD mil | 2.63 | 2.39 | 2,854 | 3,157 | 3,520 | ||||||||||||
| Net Debt | USD mil | -506 | -674 | 1,973 | 2,205 | 2,444 | ||||||||||||
| Working Capital | USD mil | -21.7 | -29.2 | -9.18 | 8.96 | -30.7 | ||||||||||||
| Capital Employed | USD mil | 1,394 | 1,422 | 4,023 | 4,572 | 5,241 | ||||||||||||
| Net Debt/Equity | % | -37.1 | -46.8 | 117 | 109 | 106 | ||||||||||||
| Current Ratio | 1.94 | 1.81 | 1.61 | 1.73 | 1.58 | |||||||||||||
| Quick Ratio | 1.70 | 1.64 | 1.44 | 1.28 | 1.35 |
| cash flow | Unit | 2011 | 2012 | 2013 | 2014 | 2015 | 2016 | 2017 | 2018 | 2019 | 2020 | 2021 | 2022 | 2023 | 2024 | 2025 | 2026 | 2027 |
| cash flow | ||||||||||||||||||
| Net Profit | USD mil | 176 | 177 | 350 | 356 | 653 | ||||||||||||
| Depreciation | USD mil | ... | ... | ... | ... | ... | ... | ... | ... | ... | ... | ... | ||||||
| Non-Cash Items | USD mil | 95.4 | 159 | 143 | 218 | 194 | ||||||||||||
| Change in Working Capital | USD mil | 33.2 | 83.9 | 15.4 | -149 | 181 | ||||||||||||
| Total Cash From Operations | USD mil | 468 | 622 | 722 | 664 | 1,282 | ||||||||||||
| Capital Expenditures | USD mil | -217 | -287 | -320 | -373 | -438 | ||||||||||||
| Net Change in LT Investment | USD mil | 0 | 0 | 0 | 0 | 0 | ... | ... | ... | ... | ... | ... | ||||||
| Net Cash From Acquisitions | USD mil | 0 | 0 | 0 | -10.0 | 0 | ... | ... | ... | ... | ... | ... | ||||||
| Other Investing Activities | USD mil | 130 | -100 | 28.0 | -49.3 | -83.6 | ||||||||||||
| Total Cash From Investing | USD mil | -86.6 | -388 | -292 | -433 | -522 | ||||||||||||
| Dividends Paid | USD mil | 0 | 0 | 0 | 0 | 0 | ||||||||||||
| Issuance Of Shares | USD mil | -286 | -166 | -201 | -103 | -546 | ||||||||||||
| Issuance Of Debt | USD mil | 0 | 0 | 0 | 0 | 0 | ||||||||||||
| Other Financing Activities | USD mil | 0.026 | -0.187 | -0.698 | -1.90 | -2.27 | ... | ... | ... | ... | ... | ... | ||||||
| Total Cash From Financing | USD mil | -286 | -167 | -202 | -105 | -549 | ||||||||||||
| Effect of FX Rates | USD mil | 2.06 | -1.46 | 0.406 | 1.08 | -1.04 | ... | ... | ... | ... | ... | ... | ||||||
| Net Change In Cash | USD mil | 97.8 | 66.0 | 228 | 127 | 210 | ||||||||||||
| ratios | ||||||||||||||||||
| Days Sales Outstanding | days | 3.30 | 4.68 | 5.26 | 6.37 | 4.82 | ||||||||||||
| Days Sales Of Inventory | days | 1.95 | 1.99 | 2.14 | 1.95 | 2.05 | ||||||||||||
| Days Payable Outstanding | days | 8.05 | 10.4 | 9.51 | 9.01 | 10.2 | ||||||||||||
| Cash Conversion Cycle | days | -2.80 | -3.77 | -2.11 | -0.681 | -3.33 | ||||||||||||
| Cash Earnings | USD mil | ... | ... | ... | ... | ... | ... | ... | ... | ... | ... | ... | ||||||
| Free Cash Flow | USD mil | 382 | 234 | 430 | 231 | 760 | ||||||||||||
| Capital Expenditures (As % of Sales) | % | 4.84 | 5.91 | 5.73 | 6.24 | 5.81 |
| other ratios | Unit | 2011 | 2012 | 2013 | 2014 | 2015 | 2016 | 2017 | 2018 | 2019 | 2020 | 2021 | 2022 | 2023 | 2024 | 2025 | 2026 | 2027 |
| Employees | 68,890 | 73,000 | 83,000 | 88,000 | 97,660 | ... | ... | ... | ... | ... | ... | |||||||
| Operating Cost (As % of Sales) | % | 10.8 | 13.4 | 12.5 | 12.5 | 12.0 | ... | ... | ... | ... | ... | ... | ||||||
| Research & Development (As % of Sales) | % | 0 | 0 | 0 | 0 | 0 | ... | ... | ... | ... | ... | ... | ||||||
| Effective Tax Rate | % | 36.1 | 34.2 | 23.6 | -21.1 | 19.7 | ||||||||||||
| Total Revenue Growth (5-year average) | % | ... | ... | ... | ... | ... | 10.4 | 8.64 | 6.34 | 5.86 | 14.1 | |||||||
| Total Revenue Growth (10-year average) | % | ... | ... | ... | ... | ... | ... | ... | ... | ... | ... | 12.8 |
| valuation | Unit | 2011 | 2012 | 2013 | 2014 | 2015 | 2016 | 2017 | 2018 | 2019 | 2020 | 2021 | 2022 | 2023 | 2024 | 2025 | 2026 | 2027 |
| Market Capitalisation | USD mil | ... | ... | ... | ... | ... | ... | 8,100 | 11,959 | 23,234 | 38,829 | 49,091 | ||||||
| Enterprise Value (EV) | USD mil | ... | ... | ... | ... | ... | ... | 7,594 | 11,285 | 25,207 | 41,035 | 51,535 | ||||||
| Number Of Shares | mil | ... | ... | ... | ... | ... | ... | 28.6 | 28.0 | 28.3 | 28.4 | 28.5 | ||||||
| Share Price | USD | ... | ... | ... | ... | ... | ... | 289 | 432 | 837 | 1,387 | 1,748 | ||||||
| EV/EBITDA | ... | ... | ... | ... | ... | ... | 17.5 | 24.5 | 26.2 | 47.8 | 36.3 | |||||||
| Price/Earnings (P/E) | ... | ... | ... | ... | ... | ... | 46.8 | 68.4 | 67.6 | 111 | 76.3 | |||||||
| Price/Cash Earnings (P/CE) | ... | ... | ... | ... | ... | ... | ... | ... | ... | ... | ... | |||||||
| P/FCF | ... | ... | ... | ... | ... | ... | 21.6 | 51.6 | 55.1 | 170 | 65.6 | |||||||
| Price/Book Value (P/BV) | ... | ... | ... | ... | ... | ... | 6.05 | 8.38 | 14.1 | 19.5 | 21.7 | |||||||
| Dividend Yield | % | ... | ... | ... | ... | ... | ... | 0 | 0 | 0 | 0 | 0 | ||||||
| Free Cash Flow Yield | % | ... | ... | ... | ... | ... | ... | 4.71 | 1.96 | 1.85 | 0.595 | 1.55 | ||||||
| Earnings Per Share (EPS) | USD | ... | ... | ... | ... | ... | ... | 6.17 | 6.31 | 12.4 | 12.5 | 22.9 | ||||||
| Cash Earnings Per Share | USD | ... | ... | ... | ... | ... | ... | ... | ... | ... | ... | ... | ||||||
| Free Cash Flow Per Share | USD | ... | ... | ... | ... | ... | ... | 13.4 | 8.37 | 15.2 | 8.13 | 26.7 | ||||||
| Book Value Per Share | USD | ... | ... | ... | ... | ... | ... | 47.8 | 51.5 | 59.5 | 71.1 | 80.6 | ||||||
| Dividend Per Share | USD | ... | ... | ... | ... | ... | ... | 0 | 0 | 0 | 0 | 0 | ||||||
| EV/Sales | ... | ... | ... | ... | ... | ... | 1.70 | 2.32 | 4.51 | 6.86 | 6.83 | |||||||
| EV/EBIT | ... | ... | ... | ... | ... | ... | 28.0 | 43.7 | 56.8 | 141 | 64.0 | |||||||
| EV/Free Cash Flow | ... | ... | ... | ... | ... | ... | 19.9 | 48.2 | 58.7 | 178 | 67.8 | |||||||
| EV/Capital Employed | ... | ... | ... | ... | ... | ... | 5.45 | 7.94 | 6.27 | 8.98 | 9.83 | |||||||
| Earnings Per Share Growth | % | ... | ... | ... | ... | ... | ... | ... | 2.27 | 96.2 | 1.13 | 82.9 | ||||||
| Cash Earnings Per Share Growth | % | ... | ... | ... | ... | ... | ... | ... | ... | ... | ... | ... | ... | |||||
| Book Value Per Share Growth | % | ... | ... | ... | ... | ... | ... | ... | 7.90 | 15.4 | 19.5 | 13.3 |
Get all company financials in excel:


By Helgi Library - May 10, 2022
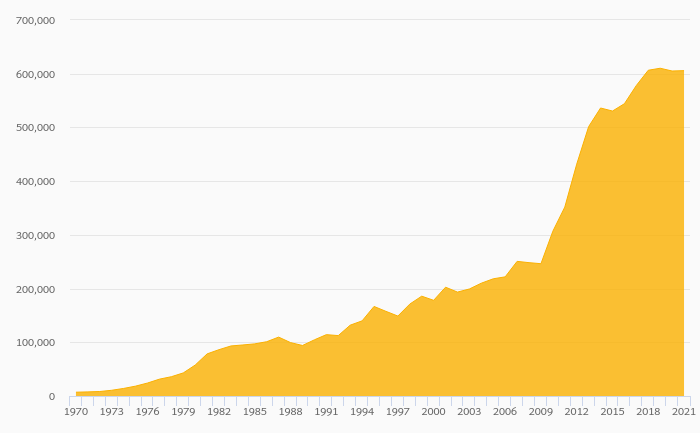
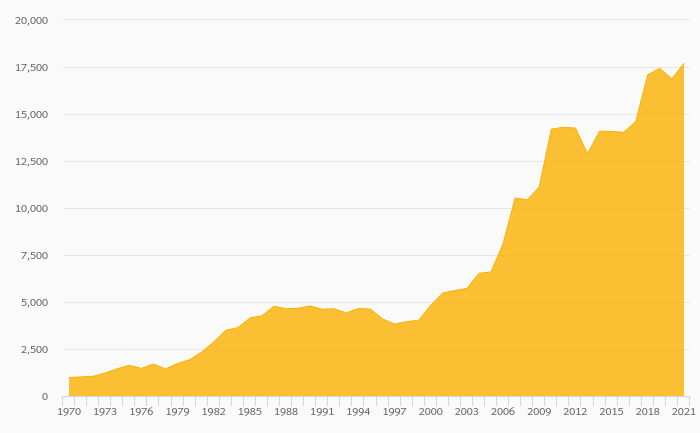
Chipotle Mexican Grill made a net profit of USD 653 mil in 2021, up 83.5% compared to the previous year. Historically, between 2011 and 2021, the company's net profit reached a high of USD 653 mil in 2021 and a low of USD 22.9 mil in 2016. The result impl...
By Helgi Library - May 10, 2022
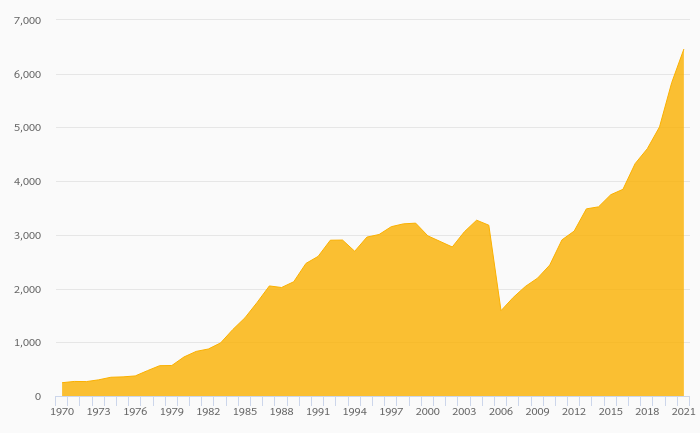
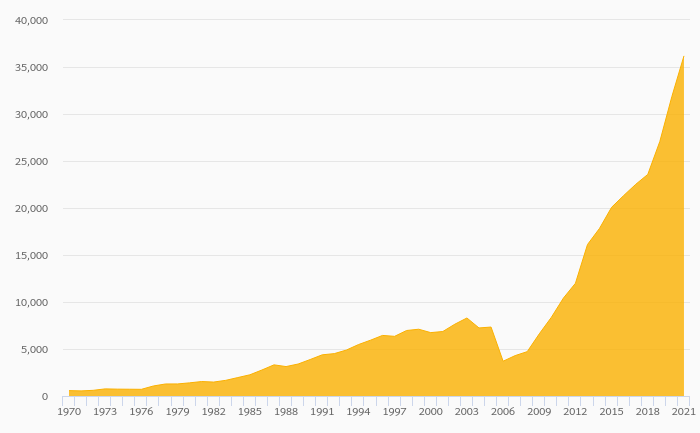
Chipotle Mexican Grill invested a total of USD 438 mil in 2021, up 17.4% compared to the previous year. Historically, between 2011 - 2021, the company's investments stood at a high of USD 438 mil in 2021 and a low of USD 151 mil in 2011. ...
By Helgi Library - May 10, 2022
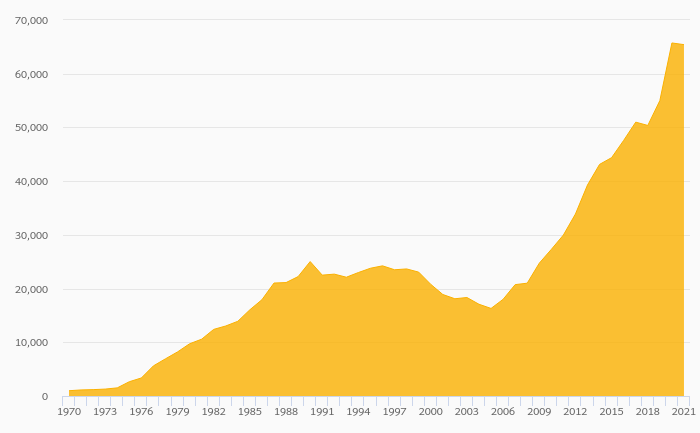
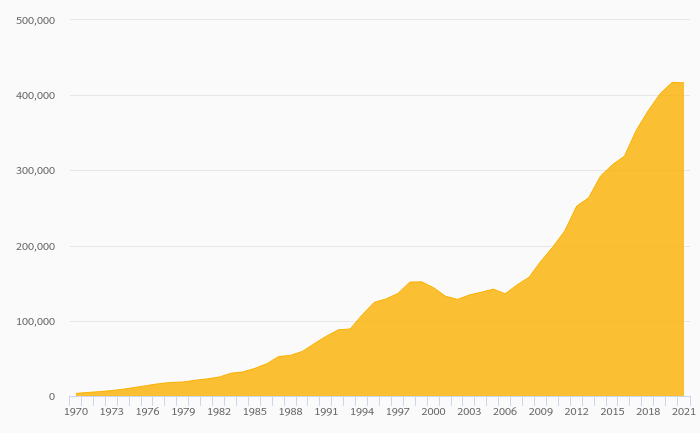
Chipotle Mexican Grill made a net profit of USD 653 mil with revenues of USD 7,547 mil in 2021, up by 83.5% and up by 26.1%, respectively, compared to the previous year. This translates into a net margin of 8.65%. Historically, between 2011 and 2021, ...
By Helgi Library - May 10, 2022
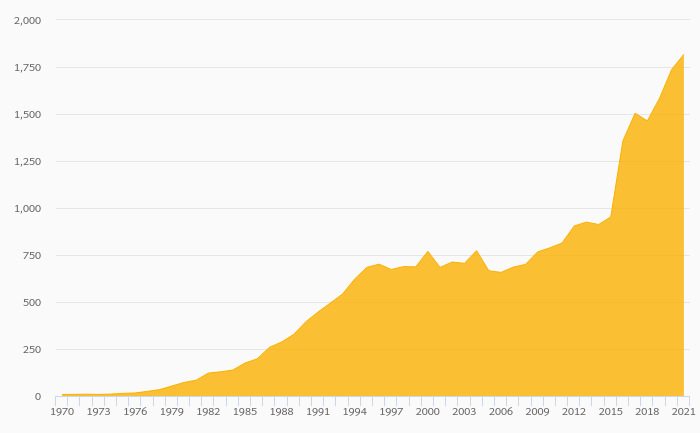
Chipotle Mexican Grill stock traded at USD 1,748 per share at the end 2021 translating into a market capitalization of USD 49,091 mil. Since the end of 2016, the stock has appreciated by 0% representing an annual average growth of %. At the end of 2021, ...
By Helgi Library - May 10, 2022
Chipotle Mexican Grill's net debt stood at USD 2,444 mil and accounted for 106% of equity at the end of 2021. The ratio is down 2.79 pp compared to the previous year. Historically, the firm’s net debt to equity reached a high of 117% in 2019 and ...
By Helgi Library - May 10, 2022
Chipotle Mexican Grill stock traded at USD 1,748 per share at the end 2021 implying a market capitalization of USD 49,091 mil. Since the end of 2016, stock has appreciated by % implying an annual average growth of % In absolute terms, the value of the company ...

Chipotle Mexican Grill has been growing its sales by 13.5% a year on average in the last 5 years. EBITDA has grown on average by 21.2% a year during that time to total of USD 3,839 mil in 2027, or 23.2% of sales. That’s compared to 21.3% average margin seen in last five years.
The company netted USD 2,530 mil in 2027 implying ROE of 28.1% and ROCE of 34.6%. Again, the average figures were 35.0% and 27.5%, respectively when looking at the previous 5 years.
Chipotle Mexican Grill’s net debt amounted to USD 1,330 mil at the end of 2027, or 13.4% of equity. When compared to EBITDA, net debt was 0.346x, down when compared to average of 0.623x seen in the last 5 years.
Chipotle Mexican Grill stock traded at USD 1,328 per share at the end of 2027 resulting in a market capitalization of USD 37,863 mil. Over the previous five years, stock price grew by 0% or 0% a year on average. The closing price put stock at a 12-month trailing EV/EBITDA of 10.2x and price to earnings (PE) of 15.0x as of 2027.
 Helgi Library