By Helgi Library - April 2, 2020
EXIM Tours's total assets reached CZK 1,129 mil at the end of 2014, down 22.8% compared to the previous year. Curr...
| Profit Statement | 2012 | 2013 | 2014 | |
| Sales | CZK mil | 3,130 | 3,263 | 3,674 |
| Gross Profit | CZK mil | 256 | 414 | 423 |
| EBITDA | CZK mil | 123 | 192 | 177 |
| EBIT | CZK mil | 117 | 186 | 171 |
| Financing Cost | CZK mil | -71.9 | 44.2 | -50.5 |
| Pre-Tax Profit | CZK mil | 189 | 141 | 222 |
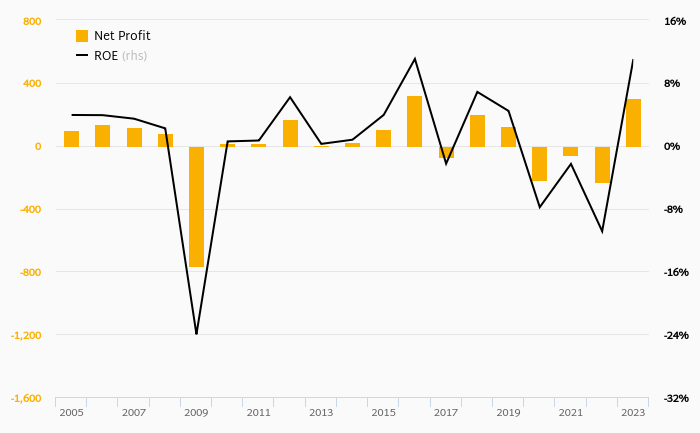
| Net Profit | CZK mil | 153 | 113 | 175 |
| Dividends | CZK mil | ... | 183 | 499 |
| Balance Sheet | 2012 | 2013 | 2014 | |
| Total Assets | CZK mil | 1,718 | 1,461 | 1,129 |
| Non-Current Assets | CZK mil | 14.1 | 97.1 | 82.5 |
| Current Assets | CZK mil | 1,678 | 1,364 | 1,046 |
| Working Capital | CZK mil | -339 | -26.8 | -207 |
| Shareholders' Equity | CZK mil | 851 | 778 | 448 |
| Liabilities | CZK mil | 867 | 683 | 680 |
| Total Debt | CZK mil | 206 | 192 | 170 |
| Net Debt | CZK mil | -910 | -445 | -229 |
| Ratios | 2012 | 2013 | 2014 | |
| ROE | % | 19.8 | 13.9 | 28.5 |
| ROCE | % | -40.8 | -89.1 | -644 |
| Gross Margin | % | 8.18 | 12.7 | 11.5 |
| EBITDA Margin | % | 3.92 | 5.88 | 4.81 |
| EBIT Margin | % | 3.75 | 5.69 | 4.66 |
| Net Margin | % | 4.90 | 3.48 | 4.75 |
| Net Debt/EBITDA | -7.42 | -2.32 | -1.30 | |
| Net Debt/Equity | -1.07 | -0.572 | -0.511 | |
| Cost of Financing | % | -31.4 | 22.2 | -27.9 |
| Cash Flow | 2012 | 2013 | 2014 | |
| Total Cash From Operations | CZK mil | ... | -291 | 340 |
| Total Cash From Investing | CZK mil | ... | -7.78 | -7.35 |
| Total Cash From Financing | CZK mil | ... | -183 | -567 |
| Net Change In Cash | CZK mil | ... | -482 | -234 |
| Cash Conversion Cycle | days | -45.0 | -9.70 | -26.4 |
| Cash Earnings | CZK mil | 159 | 120 | 180 |
| Free Cash Flow | CZK mil | ... | -299 | 332 |
Get all company financials in excel:
| summary | Unit | 2007 | 2008 | 2009 | 2010 | 2011 | 2012 | 2013 | 2014 | 2015 |
| income statement | ||||||||||
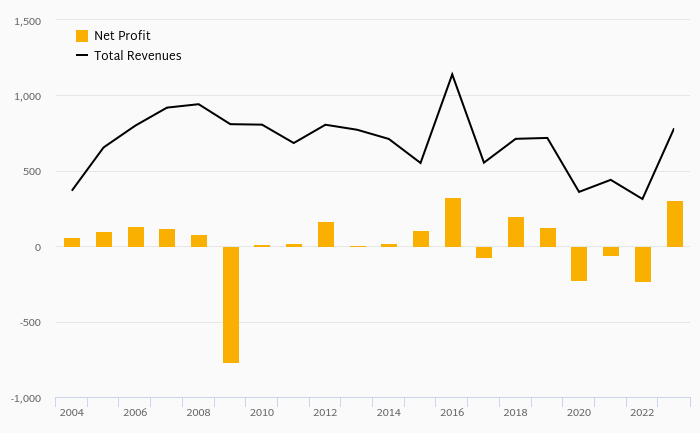
| Sales | CZK mil | 3,400 | 3,292 | 3,179 | 3,130 | 3,263 | ... | |||
| Gross Profit | CZK mil | 275 | 209 | 270 | 256 | 414 | ... | |||
| EBIT | CZK mil | 123 | 60.0 | 133 | 117 | 186 | ... | |||
| Net Profit | CZK mil | 134 | 141 | 132 | 153 | 113 | ... | |||
| ROE | % | 37.4 | 28.6 | 20.9 | 19.8 | 13.9 | ... | |||
| EBIT Margin | % | 3.63 | 1.82 | 4.18 | 3.75 | 5.69 | ... | |||
| Net Margin | % | 3.94 | 4.29 | 4.16 | 4.90 | 3.48 | ... | |||
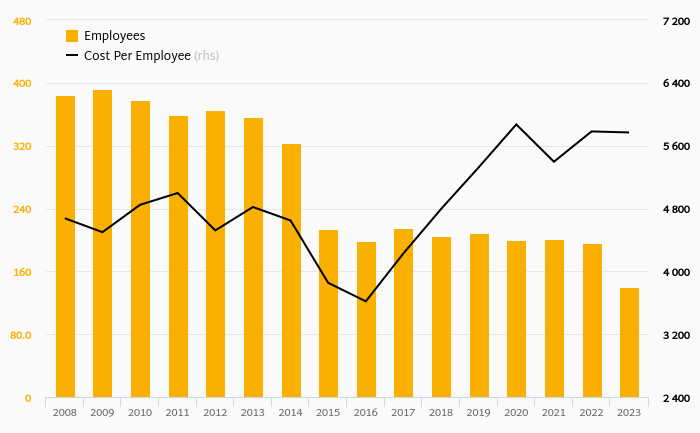
| Employees | 254 | 252 | 247 | 250 | 270 | ... | ||||
| balance sheet | ||||||||||
| Total Assets | CZK mil | 1,688 | 1,835 | 1,754 | 1,718 | 1,461 | ... | |||
| Non-Current Assets | CZK mil | 40.0 | 47.9 | 43.2 | 14.1 | 97.1 | ... | |||
| Current Assets | CZK mil | 1,609 | 1,774 | 1,684 | 1,678 | 1,364 | ... | |||
| Shareholders' Equity | CZK mil | 425 | 566 | 698 | 851 | 778 | ... | |||
| Liabilities | CZK mil | 1,263 | 1,269 | 1,056 | 867 | 683 | ... | |||
| Non-Current Liabilities | CZK mil | 0 | 0 | 0 | 0 | 0 | ... | |||
| Current Liabilities | CZK mil | 885 | 913 | 868 | 794 | 683 | ... | |||
| Net Debt/EBITDA | -5.97 | -14.2 | -7.49 | -7.42 | -2.32 | ... | ||||
| Net Debt/Equity | -1.79 | -1.62 | -1.49 | -1.07 | -0.572 | ... | ||||
| Cost of Financing | % | ... | -11.7 | -45.3 | -12.4 | -31.4 | 22.2 | ... | ||
| cash flow | ||||||||||
| Total Cash From Operations | CZK mil | ... | ... | ... | ... | ... | ... | -291 | ... | |
| Total Cash From Investing | CZK mil | ... | ... | ... | ... | ... | ... | -7.78 | ... | |
| Total Cash From Financing | CZK mil | ... | ... | ... | ... | ... | ... | -183 | ... | |
| Net Change In Cash | CZK mil | ... | ... | ... | ... | ... | ... | -482 | ... |
| income statement | Unit | 2007 | 2008 | 2009 | 2010 | 2011 | 2012 | 2013 | 2014 | 2015 |
| income statement | ||||||||||
| Sales | CZK mil | 3,400 | 3,292 | 3,179 | 3,130 | 3,263 | ... | |||
| Cost of Goods & Services | CZK mil | 3,125 | 3,083 | 2,908 | 2,873 | 2,849 | ... | |||
| Gross Profit | CZK mil | 275 | 209 | 270 | 256 | 414 | ... | |||
| Staff Cost | CZK mil | 123 | 132 | 135 | 137 | 113 | ... | |||
| Other Cost | CZK mil | 24.4 | 12.4 | -3.31 | -4.05 | 109 | ... | |||
| EBITDA | CZK mil | 128 | 64.6 | 138 | 123 | 192 | ... | |||
| Depreciation | CZK mil | 4.01 | 4.58 | 5.66 | 5.54 | 6.18 | ... | |||
| EBIT | CZK mil | 123 | 60.0 | 133 | 117 | 186 | ... | |||
| Financing Cost | CZK mil | -36.6 | -114 | -30.2 | -71.9 | 44.2 | ... | |||
| Extraordinary Cost | CZK mil | -0.200 | 0 | 0 | 0 | 0 | ... | |||
| Pre-Tax Profit | CZK mil | 160 | 174 | 163 | 189 | 141 | ... | |||
| Tax | CZK mil | 26.5 | 33.0 | 30.8 | 35.9 | 28.1 | ... | |||
| Minorities | CZK mil | 0 | 0 | 0 | 0 | 0 | ... | |||
| Net Profit | CZK mil | 134 | 141 | 132 | 153 | 113 | ... | |||
| Dividends | CZK mil | ... | ... | ... | ... | ... | ... | 183 | ... | |
| growth rates | ||||||||||
| Total Revenue Growth | % | ... | -3.50 | -3.17 | -3.46 | -1.54 | 4.27 | ... | ||
| Operating Cost Growth | % | ... | 15.2 | -1.60 | -9.03 | 1.26 | 66.3 | |||
| EBITDA Growth | % | ... | -32.0 | -49.3 | 114 | -11.4 | 56.3 | ... | ||
| EBIT Growth | % | ... | -32.7 | -51.4 | 121 | -11.8 | 58.4 | ... | ||
| Pre-Tax Profit Growth | % | ... | -11.0 | 8.76 | -6.53 | 16.0 | -25.2 | ... | ||
| Net Profit Growth | % | ... | -5.53 | 5.68 | -6.53 | 15.9 | -26.0 | ... | ||
| ratios | ||||||||||
| ROE | % | 37.4 | 28.6 | 20.9 | 19.8 | 13.9 | ... | |||
| ROCE | % | ... | -37.9 | -44.1 | -33.9 | -40.8 | -89.1 | ... | ||
| Gross Margin | % | 8.08 | 6.36 | 8.50 | 8.18 | 12.7 | ... | |||
| EBITDA Margin | % | 3.75 | 1.96 | 4.36 | 3.92 | 5.88 | ... | |||
| EBIT Margin | % | 3.63 | 1.82 | 4.18 | 3.75 | 5.69 | ... | |||
| Net Margin | % | 3.94 | 4.29 | 4.16 | 4.90 | 3.48 | ... | |||
| Payout Ratio | % | ... | ... | ... | ... | ... | ... | 162 | ... | |
| Cost of Financing | % | ... | -11.7 | -45.3 | -12.4 | -31.4 | 22.2 | ... | ||
| Net Debt/EBITDA | -5.97 | -14.2 | -7.49 | -7.42 | -2.32 | ... |
| balance sheet | Unit | 2007 | 2008 | 2009 | 2010 | 2011 | 2012 | 2013 | 2014 | 2015 |
| balance sheet | ||||||||||
| Non-Current Assets | CZK mil | 40.0 | 47.9 | 43.2 | 14.1 | 97.1 | ... | |||
| Property, Plant & Equipment | CZK mil | 39.4 | 47.4 | 42.9 | 13.7 | 15.1 | ... | |||
| Intangible Assets | CZK mil | 0.627 | 0.511 | 0.371 | 0.384 | 3.67 | ... | |||
| Current Assets | CZK mil | 1,609 | 1,774 | 1,684 | 1,678 | 1,364 | ... | |||
| Inventories | CZK mil | 0.209 | 0 | 0 | 0 | 0 | ... | |||
| Receivables | CZK mil | 272 | 230 | 81.5 | 190 | 386 | ... | |||
| Cash & Cash Equivalents | CZK mil | 1,031 | 1,153 | 1,291 | 1,116 | 637 | ... | |||
| Total Assets | CZK mil | 1,688 | 1,835 | 1,754 | 1,718 | 1,461 | ... | |||
| Shareholders' Equity | CZK mil | 425 | 566 | 698 | 851 | 778 | ... | |||
| Of Which Minority Interest | CZK mil | 0 | 0 | 0 | 0 | 0 | ... | |||
| Liabilities | CZK mil | 1,263 | 1,269 | 1,056 | 867 | 683 | ... | |||
| Non-Current Liabilities | CZK mil | 0 | 0 | 0 | 0 | 0 | ... | |||
| Long-Term Debt | CZK mil | 0 | 0 | 0 | 0 | 0 | ... | |||
| Deferred Tax Liabilities | CZK mil | 0 | 0 | 0 | 0 | 0 | ... | |||
| Current Liabilities | CZK mil | 885 | 913 | 868 | 794 | 683 | ... | |||
| Short-Term Debt | CZK mil | 270 | 234 | 253 | 206 | 192 | ... | |||
| Trade Payables | CZK mil | 599 | 632 | 552 | 529 | 413 | ... | |||
| Provisions | CZK mil | 47.3 | 50.4 | 52.1 | 50.7 | 1.62 | ... | |||
| Equity And Liabilities | CZK mil | 1,688 | 1,835 | 1,754 | 1,718 | 1,461 | ... | |||
| growth rates | ||||||||||
| Total Asset Growth | % | ... | 12.1 | 8.69 | -4.40 | -2.04 | -15.0 | ... | ||
| Shareholders' Equity Growth | % | ... | 46.0 | 33.3 | 23.4 | 21.9 | -8.57 | ... | ||
| Net Debt Growth | % | ... | 11.5 | 20.7 | 13.0 | -12.3 | -51.1 | ... | ||
| Total Debt Growth | % | ... | -24.2 | -13.4 | 8.01 | -18.6 | -6.60 | ... | ||
| ratios | ||||||||||
| Total Debt | CZK mil | 270 | 234 | 253 | 206 | 192 | ... | |||
| Net Debt | CZK mil | -761 | -919 | -1,038 | -910 | -445 | ... | |||
| Working Capital | CZK mil | -327 | -402 | -470 | -339 | -26.8 | ... | |||
| Capital Employed | CZK mil | -287 | -354 | -427 | -325 | 70.3 | ... | |||
| Net Debt/Equity | -1.79 | -1.62 | -1.49 | -1.07 | -0.572 | ... | ||||
| Cost of Financing | % | ... | -11.7 | -45.3 | -12.4 | -31.4 | 22.2 | ... |
| cash flow | Unit | 2007 | 2008 | 2009 | 2010 | 2011 | 2012 | 2013 | 2014 | 2015 |
| cash flow | ||||||||||
| Net Profit | CZK mil | 134 | 141 | 132 | 153 | 113 | ... | |||
| Depreciation | CZK mil | 4.01 | 4.58 | 5.66 | 5.54 | 6.18 | ... | |||
| Non-Cash Items | CZK mil | ... | ... | ... | ... | ... | ... | -98.6 | ... | |
| Change in Working Capital | CZK mil | ... | ... | ... | ... | ... | ... | -312 | ... | |
| Total Cash From Operations | CZK mil | ... | ... | ... | ... | ... | ... | -291 | ... | |
| Capital Expenditures | CZK mil | ... | ... | ... | ... | ... | ... | -7.78 | ... | |
| Other Investments | CZK mil | ... | ... | ... | ... | ... | ... | 0 | ... | |
| Total Cash From Investing | CZK mil | ... | ... | ... | ... | ... | ... | -7.78 | ... | |
| Dividends Paid | CZK mil | ... | ... | ... | ... | ... | ... | -183 | ... | |
| Issuance Of Debt | CZK mil | ... | ... | ... | ... | ... | ... | -13.6 | ... | |
| Total Cash From Financing | CZK mil | ... | ... | ... | ... | ... | ... | -183 | ... | |
| Net Change In Cash | CZK mil | ... | ... | ... | ... | ... | ... | -482 | ... | |
| ratios | ||||||||||
| Days Sales Outstanding | days | 29.2 | 25.5 | 9.36 | 22.2 | 43.2 | ... | |||
| Days Sales Of Inventory | days | 0.024 | 0 | 0 | 0 | 0 | ... | |||
| Days Payable Outstanding | days | 69.9 | 74.8 | 69.3 | 67.2 | 52.9 | ... | |||
| Cash Conversion Cycle | days | -40.7 | -49.3 | -59.9 | -45.0 | -9.70 | ... | |||
| Cash Earnings | CZK mil | 138 | 146 | 138 | 159 | 120 | ... | |||
| Free Cash Flow | CZK mil | ... | ... | ... | ... | ... | ... | -299 | ... |
| other data | Unit | 2007 | 2008 | 2009 | 2010 | 2011 | 2012 | 2013 | 2014 | 2015 |
| other data | ||||||||||
| ROA | % | 8.38 | 8.03 | 7.37 | 8.83 | 7.14 | ... | |||
| Gross Margin | % | 8.08 | 6.36 | 8.50 | 8.18 | 12.7 | ... | |||
| Employees | 254 | 252 | 247 | 250 | 270 | ... | ||||
| Cost Per Employee | USD per month | 2,113 | 2,290 | 2,576 | 2,342 | 1,778 | ... | |||
| Cost Per Employee (Local Currency) | CZK per month | 40,265 | 43,772 | 45,557 | 45,808 | 34,780 | ... | |||
| Staff Cost (As % Of Total Cost) | % | 3.75 | 4.10 | 4.43 | 4.56 | 3.66 | ... | |||
| Effective Tax Rate | % | 16.5 | 18.9 | 18.9 | 19.0 | 19.8 | ... | |||
| Capital Expenditures (As % of Sales) | % | ... | ... | ... | ... | ... | ... | 0.239 | ... | |
| Number of Branches | ... | ... | ... | ... | ... | ... | ... | ... |
Get all company financials in excel:


EXIM TOURS a.s is a Czech Republic-based travel agency. Its services include stays in the mountains, tours in the Czech Republic, sightseeing tours, hotel facilities in Prague and outside of Prague, walking tours in historical centers, and excursions. The Company operates in Slovakia, Hungary, Romania and Poland. The Company was founded in 1992 and is based in Praha, Czech Republic and has additional offices in Warsaw, Bratislava, Budapest, and Bucharest. As of the end of 2012, EXIM TOURS a.s. operated as a subsidiary of REWE Touristik GmbH.
EXIM Tours has been growing its sales by a year on average in the last 5 years. EBITDA has grown by 0% during that time to total of in 2015, or of sales. That’s compared to 4.74% average margin seen in last five years.
The company netted in 2015 implying ROE of and ROCE of . Again, the average figures were 20.8% and -202%, respectively when looking at the previous 5 years.
EXIM Tours’s net debt amounted to at the end of 2015, or of equity. When compared to EBITDA, net debt was x, up when compared to average of -4.63x seen in the last 5 years.
 Helgi Library