By Helgi Library - August 26, 2022
u-Blox Holding made a net profit of CHF 15.3 mil with revenues of CHF 414 mil in 2021, up by 124% and up by 24.2%, ...
By Helgi Library - August 26, 2022
u-Blox Holding stock traded at CHF 70.5 per share at the end 2021 translating into a market capitalization of USD 535 mil. Since ...
By Helgi Library - August 26, 2022
u-Blox Holding's net debt stood at CHF 8.89 mil and accounted for 2.94% of equity at the end of 2021. The ratio is down ...
| Profit Statement | 2024 | 2025 | 2026 | |
| Sales | CHF mil | 621 | 665 | 708 |
| Gross Profit | CHF mil | 284 | 306 | 326 |
| EBITDA | CHF mil | 102 | 122 | 131 |
| EBIT | CHF mil | 55.0 | 68.7 | 74.9 |
| Financing Cost | CHF mil | -4.19 | -4.33 | -6.92 |
| Pre-Tax Profit | CHF mil | 59.2 | 73.0 | 81.9 |
| Net Profit | CHF mil | 39.2 | 58.1 | 65.1 |
| Dividends | CHF mil | 12.0 | 16.0 | 17.8 |
| Balance Sheet | 2024 | 2025 | 2026 | |
| Total Assets | CHF mil | 553 | 571 | 589 |
| Non-Current Assets | CHF mil | 331 | 341 | 351 |
| Current Assets | CHF mil | 222 | 230 | 238 |
| Working Capital | CHF mil | 68.7 | 72.9 | 77.4 |
| Shareholders' Equity | CHF mil | 391 | 447 | 494 |
| Liabilities | CHF mil | 162 | 124 | 95.1 |
| Total Debt | CHF mil | 123 | 133 | 143 |
| Net Debt | CHF mil | 37.8 | 47.8 | 57.8 |
| Ratios | 2024 | 2025 | 2026 | |
| ROE | % | 10.4 | 13.9 | 13.8 |
| ROCE | % | 9.99 | 14.3 | 15.4 |
| Gross Margin | % | 45.8 | 46.1 | 46.1 |
| EBITDA Margin | % | 16.5 | 18.3 | 18.4 |
| EBIT Margin | % | 8.87 | 10.3 | 10.6 |
| Net Margin | % | 6.32 | 8.74 | 9.19 |
| Net Debt/EBITDA | 0.369 | 0.392 | 0.443 | |
| Net Debt/Equity | % | 9.67 | 10.7 | 11.7 |
| Cost of Financing | % | -3.56 | -3.40 | -5.03 |
| Valuation | 2024 | 2025 | 2026 | |
| Market Capitalisation | USD mil | 1,017 | 1,017 | 1,017 |
| Enterprise Value (EV) | USD mil | 1,058 | 1,069 | 1,080 |
| Number Of Shares | mil | 6.94 | 6.94 | 6.94 |
| Share Price | CHF | 134 | 134 | 134 |
| EV/EBITDA | 9.43 | 8.00 | 7.56 | |
| EV/Sales | 1.56 | 1.47 | 1.39 | |
| Price/Earnings (P/E) | 23.7 | 16.0 | 14.3 | |
| Price/Book Value (P/BV) | 2.37 | 2.08 | 1.88 | |
| Dividend Yield | % | 1.29 | 1.73 | 1.92 |
Get all company financials in excel:
| overview | Unit | 2011 | 2012 | 2013 | 2014 | 2015 | 2016 | 2017 | 2018 | 2019 | 2020 | 2021 | 2022 | 2023 | 2024 | 2025 | 2026 |
| income statement | |||||||||||||||||
| Sales | CHF mil | 404 | 393 | 385 | 334 | 414 | |||||||||||
| Gross Profit | CHF mil | 184 | 177 | 174 | 150 | 194 | |||||||||||
| EBIT | CHF mil | 65.1 | 48.3 | 22.1 | -64.8 | 25.9 | |||||||||||
| Net Profit | CHF mil | 51.3 | 38.5 | 13.1 | -64.6 | 15.3 | |||||||||||
| ROE | % | ... | 17.0 | 11.5 | 3.73 | -20.4 | 5.24 | ||||||||||
| EBIT Margin | % | 16.1 | 12.3 | 5.73 | -19.4 | 6.25 | |||||||||||
| Net Margin | % | 12.7 | 9.78 | 3.39 | -19.4 | 3.70 | |||||||||||
| Employees | 947 | ... | ... | ... | ... | ... | ... | ... | ... | ... | |||||||
| balance sheet | |||||||||||||||||
| Total Assets | CHF mil | 525 | 553 | 586 | 518 | 504 | |||||||||||
| Non-Current Assets | CHF mil | 241 | 276 | 325 | 300 | 303 | |||||||||||
| Current Assets | CHF mil | 283 | 277 | 260 | 218 | 201 | |||||||||||
| Shareholders' Equity | CHF mil | 319 | 349 | 352 | 283 | 302 | |||||||||||
| Liabilities | CHF mil | 206 | 204 | 234 | 235 | 202 | |||||||||||
| Non-Current Liabilities | CHF mil | 147 | 149 | 173 | 123 | 123 | |||||||||||
| Current Liabilities | CHF mil | 58.9 | 55.5 | 61.4 | 112 | 79.5 | |||||||||||
| Net Debt/EBITDA | -0.613 | -0.259 | 0.252 | -1.53 | 0.135 | ||||||||||||
| Net Debt/Equity | % | -16.8 | -5.31 | 3.78 | 21.0 | 2.94 | |||||||||||
| Cost of Financing | % | ... | 1.29 | 1.61 | 1.95 | 1.81 | 2.26 | ||||||||||
| cash flow | |||||||||||||||||
| Total Cash From Operations | CHF mil | 59.7 | 35.1 | 75.1 | 37.1 | 95.2 | |||||||||||
| Total Cash From Investing | CHF mil | -63.9 | -64.0 | -67.2 | -56.2 | -42.0 | |||||||||||
| Total Cash From Financing | CHF mil | 27.2 | -7.76 | -15.1 | -8.60 | -65.0 | |||||||||||
| Net Change In Cash | CHF mil | 20.1 | -33.3 | -8.87 | -33.6 | -10.6 | |||||||||||
| valuation | |||||||||||||||||
| Market Capitalisation | USD mil | ... | ... | ... | ... | ... | ... | 1,374 | 557 | 711 | 461 | 535 | |||||
| Enterprise Value (EV) | USD mil | ... | ... | ... | ... | ... | ... | 1,319 | 538 | 724 | 528 | 545 | |||||
| Number Of Shares | mil | ... | ... | ... | ... | ... | ... | 6.98 | 6.92 | 6.92 | 6.94 | 6.94 | |||||
| Share Price | CHF | ... | ... | ... | ... | ... | ... | 192 | 79.0 | 99.2 | 58.9 | 70.5 | |||||
| Price/Earnings (P/E) | ... | ... | ... | ... | ... | ... | 26.1 | 14.2 | 52.6 | -6.32 | 31.9 | ||||||
| Price/Cash Earnings (P/CE) | ... | ... | ... | ... | ... | ... | 22.1 | 11.4 | 25.5 | -7.79 | 18.2 | ||||||
| EV/EBITDA | ... | ... | ... | ... | ... | ... | 15.1 | 7.36 | 13.4 | -12.6 | 7.43 | ||||||
| Price/Book Value (P/BV) | ... | ... | ... | ... | ... | ... | 4.21 | 1.57 | 1.95 | 1.44 | 1.62 | ||||||
| Dividend Yield | % | ... | ... | ... | ... | ... | ... | 1.08 | 2.86 | 1.62 | 1.02 | 0.852 |
| income statement | Unit | 2011 | 2012 | 2013 | 2014 | 2015 | 2016 | 2017 | 2018 | 2019 | 2020 | 2021 | 2022 | 2023 | 2024 | 2025 | 2026 |
| income statement | |||||||||||||||||
| Sales | CHF mil | 404 | 393 | 385 | 334 | 414 | |||||||||||
| Cost of Goods & Services | CHF mil | 220 | 216 | 211 | 183 | 220 | |||||||||||
| Gross Profit | CHF mil | 184 | 177 | 174 | 150 | 194 | |||||||||||
| Selling, General & Admin | CHF mil | 55.3 | 57.7 | 59.9 | 56.6 | 66.6 | ... | ... | ... | ... | ... | ||||||
| Research & Development | CHF mil | 65.6 | 74.9 | 96.3 | 160 | 106 | ... | ... | ... | ... | ... | ||||||
| Other Operating Expense | CHF mil | 0 | 0 | 0 | 0 | 0 | ... | ... | ... | ... | ... | ||||||
| Staff Cost | CHF mil | 70.5 | 69.8 | 78.7 | 90.8 | 108 | ... | ... | ... | ... | ... | ||||||
| Other Operating Cost (Income) | CHF mil | 1.92 | 3.82 | 3.73 | 1.67 | 5.14 | ... | ... | ... | ... | ... | ||||||
| EBITDA | CHF mil | 87.2 | 71.6 | 52.6 | -38.7 | 65.8 | |||||||||||
| Depreciation | CHF mil | 9.27 | 9.30 | 13.9 | 12.2 | 11.5 | |||||||||||
| EBIT | CHF mil | 65.1 | 48.3 | 22.1 | -64.8 | 25.9 | |||||||||||
| Net Financing Cost | CHF mil | 0.871 | 1.57 | 2.30 | 2.59 | 2.70 | |||||||||||
| Financing Cost | CHF mil | 1.15 | 1.92 | 2.54 | 2.68 | 2.79 | |||||||||||
| Financing Income | CHF mil | 0.280 | 0.348 | 0.242 | 0.088 | 0.091 | ... | ... | ... | ... | ... | ||||||
| FX (Gain) Loss | CHF mil | 3.52 | -4.79 | 0 | 0 | 7.71 | ... | ... | ... | ... | ... | ||||||
| (Income) / Loss from Affiliates | CHF mil | 0.400 | 3.34 | 4.25 | 4.16 | 1.82 | ... | ... | ... | ... | ... | ||||||
| Extraordinary Cost | CHF mil | 0 | 0 | 0 | 0 | 0 | ... | ... | ... | ... | ... | ||||||
| Pre-Tax Profit | CHF mil | 64.7 | 48.1 | 14.2 | -79.1 | 21.1 | |||||||||||
| Tax | CHF mil | 13.4 | 9.62 | 1.31 | -14.2 | 5.73 | |||||||||||
| Minorities | CHF mil | 0 | 0 | -0.149 | -0.238 | 0.021 | |||||||||||
| Net Profit | CHF mil | 51.3 | 38.5 | 13.1 | -64.6 | 15.3 | |||||||||||
| Net Profit Avail. to Common | CHF mil | 51.3 | 38.5 | 13.1 | -64.6 | 15.3 | |||||||||||
| Dividends | CHF mil | 14.3 | 15.6 | 11.1 | 4.16 | 4.16 | |||||||||||
| growth rates | |||||||||||||||||
| Total Revenue Growth | % | ... | 12.1 | -2.59 | -2.08 | -13.4 | 24.2 | ||||||||||
| Operating Cost Growth | % | ... | 9.73 | 9.76 | 17.7 | 38.9 | -20.3 | ... | ... | ... | ... | ... | |||||
| Staff Cost Growth | % | ... | 7.06 | -0.959 | 12.7 | 15.4 | 18.5 | ... | ... | ... | ... | ... | |||||
| EBITDA Growth | % | ... | 6.70 | -17.9 | -26.6 | -174 | -270 | ||||||||||
| EBIT Growth | % | ... | 10.3 | -25.8 | -54.3 | -394 | -140 | ||||||||||
| Pre-Tax Profit Growth | % | ... | 4.89 | -25.7 | -70.4 | -656 | -127 | ||||||||||
| Net Profit Growth | % | ... | 11.0 | -24.9 | -66.1 | -595 | -124 | ||||||||||
| ratios | |||||||||||||||||
| ROE | % | ... | 17.0 | 11.5 | 3.73 | -20.4 | 5.24 | ||||||||||
| ROA | % | ... | 10.8 | 7.14 | 2.29 | -11.7 | 3.00 | ||||||||||
| ROCE | % | ... | 18.5 | 11.2 | 3.38 | -17.2 | 4.32 | ||||||||||
| Gross Margin | % | 45.6 | 45.0 | 45.3 | 45.1 | 46.7 | |||||||||||
| EBITDA Margin | % | 21.6 | 18.2 | 13.7 | -11.6 | 15.9 | |||||||||||
| EBIT Margin | % | 16.1 | 12.3 | 5.73 | -19.4 | 6.25 | |||||||||||
| Net Margin | % | 12.7 | 9.78 | 3.39 | -19.4 | 3.70 | |||||||||||
| Payout Ratio | % | 28.0 | 40.5 | 85.0 | -6.44 | 27.2 | |||||||||||
| Cost of Financing | % | ... | 1.29 | 1.61 | 1.95 | 1.81 | 2.26 | ||||||||||
| Net Debt/EBITDA | -0.613 | -0.259 | 0.252 | -1.53 | 0.135 |
| balance sheet | Unit | 2011 | 2012 | 2013 | 2014 | 2015 | 2016 | 2017 | 2018 | 2019 | 2020 | 2021 | 2022 | 2023 | 2024 | 2025 | 2026 |
| balance sheet | |||||||||||||||||
| Cash & Cash Equivalents | CHF mil | 172 | 138 | 128 | 94.4 | 83.7 | |||||||||||
| Receivables | CHF mil | 50.4 | 60.8 | 48.5 | 34.0 | 51.1 | |||||||||||
| Inventories | CHF mil | 44.2 | 57.5 | 51.6 | 33.6 | 31.4 | |||||||||||
| Other ST Assets | CHF mil | 16.3 | 20.9 | 32.1 | 56.1 | 35.2 | |||||||||||
| Current Assets | CHF mil | 283 | 277 | 260 | 218 | 201 | |||||||||||
| Property, Plant & Equipment | CHF mil | 17.5 | 14.8 | 34.5 | 42.5 | 43.3 | |||||||||||
| LT Investments & Receivables | CHF mil | 1.14 | 1.06 | 1.07 | 1.19 | 1.07 | |||||||||||
| Intangible Assets | CHF mil | 212 | 249 | 275 | 237 | 249 | |||||||||||
| Goodwill | CHF mil | 57.6 | 55.2 | 56.0 | 59.9 | 58.2 | |||||||||||
| Non-Current Assets | CHF mil | 241 | 276 | 325 | 300 | 303 | |||||||||||
| Total Assets | CHF mil | 525 | 553 | 586 | 518 | 504 | |||||||||||
| Trade Payables | CHF mil | 20.3 | 21.6 | 25.4 | 17.8 | 25.0 | |||||||||||
| Short-Term Debt | CHF mil | 0 | 0 | 5.31 | 64.7 | 5.39 | |||||||||||
| Other ST Liabilities | CHF mil | 0.150 | 0 | 0 | 0 | 0 | |||||||||||
| Current Liabilities | CHF mil | 58.9 | 55.5 | 61.4 | 112 | 79.5 | |||||||||||
| Long-Term Debt | CHF mil | 119 | 119 | 136 | 89.0 | 87.2 | |||||||||||
| Other LT Liabilities | CHF mil | 28.1 | 29.5 | 36.6 | 34.1 | 35.7 | |||||||||||
| Non-Current Liabilities | CHF mil | 147 | 149 | 173 | 123 | 123 | |||||||||||
| Liabilities | CHF mil | 206 | 204 | 234 | 235 | 202 | |||||||||||
| Preferred Equity and Hybrid Capital | CHF mil | 0 | 0 | 0 | 0 | 0 | |||||||||||
| Share Capital | CHF mil | 72.8 | 72.7 | 126 | 122 | 122 | |||||||||||
| Treasury Stock | CHF mil | 24.4 | 32.0 | 32.0 | 31.9 | 31.9 | |||||||||||
| Equity Before Minority Interest | CHF mil | 319 | 349 | 351 | 283 | 302 | |||||||||||
| Minority Interest | CHF mil | 0 | 0 | 0.135 | 0.140 | 0 | |||||||||||
| Equity | CHF mil | 319 | 349 | 352 | 283 | 302 | |||||||||||
| growth rates | |||||||||||||||||
| Total Asset Growth | % | ... | 23.5 | 5.44 | 5.95 | -11.6 | -2.59 | ||||||||||
| Shareholders' Equity Growth | % | ... | 11.9 | 9.53 | 0.780 | -19.6 | 6.84 | ||||||||||
| Net Debt Growth | % | ... | -45.2 | -65.4 | -172 | 347 | -85.0 | ||||||||||
| Total Debt Growth | % | ... | ... | ... | 100 | 0.212 | 18.8 | 8.52 | -39.7 | ||||||||
| ratios | |||||||||||||||||
| Total Debt | CHF mil | 119 | 119 | 142 | 154 | 92.6 | |||||||||||
| Net Debt | CHF mil | -53.5 | -18.5 | 13.3 | 59.3 | 8.89 | |||||||||||
| Working Capital | CHF mil | 74.3 | 96.7 | 74.6 | 49.8 | 57.5 | |||||||||||
| Capital Employed | CHF mil | 316 | 373 | 400 | 350 | 360 | |||||||||||
| Net Debt/Equity | % | -16.8 | -5.31 | 3.78 | 21.0 | 2.94 | |||||||||||
| Current Ratio | 4.81 | 4.99 | 4.24 | 1.94 | 2.53 | ||||||||||||
| Quick Ratio | 3.78 | 3.58 | 2.88 | 1.14 | 1.70 |
| cash flow | Unit | 2011 | 2012 | 2013 | 2014 | 2015 | 2016 | 2017 | 2018 | 2019 | 2020 | 2021 | 2022 | 2023 | 2024 | 2025 | 2026 |
| cash flow | |||||||||||||||||
| Net Profit | CHF mil | 51.3 | 38.5 | 13.1 | -64.6 | 15.3 | |||||||||||
| Depreciation | CHF mil | 9.27 | 9.30 | 13.9 | 12.2 | 11.5 | |||||||||||
| Non-Cash Items | CHF mil | 4.27 | 5.46 | 15.4 | 72.2 | 12.2 | |||||||||||
| Change in Working Capital | CHF mil | -18.0 | -32.2 | 16.2 | 3.37 | 27.7 | |||||||||||
| Total Cash From Operations | CHF mil | 59.7 | 35.1 | 75.1 | 37.1 | 95.2 | |||||||||||
| Capital Expenditures | CHF mil | -64.9 | -61.4 | -56.9 | -42.7 | -43.1 | |||||||||||
| Net Change in LT Investment | CHF mil | 5.13 | 1.47 | 0.981 | 0.015 | 0.029 | ... | ... | ... | ... | ... | ||||||
| Net Cash From Acquisitions | CHF mil | -4.06 | -4.11 | -11.2 | -13.5 | 1.09 | ... | ... | ... | ... | ... | ||||||
| Other Investing Activities | CHF mil | 0 | 0 | 0 | 0 | 0 | |||||||||||
| Total Cash From Investing | CHF mil | -63.9 | -64.0 | -67.2 | -56.2 | -42.0 | |||||||||||
| Dividends Paid | CHF mil | -14.5 | -15.4 | -11.1 | 0 | 0 | |||||||||||
| Issuance Of Shares | CHF mil | -17.6 | 7.68 | 0.876 | 0.107 | 0 | |||||||||||
| Issuance Of Debt | CHF mil | 59.3 | 0 | -4.91 | -5.48 | -90.0 | |||||||||||
| Other Financing Activities | CHF mil | 0 | 0 | 0 | -3.22 | 25.0 | ... | ... | ... | ... | ... | ||||||
| Total Cash From Financing | CHF mil | 27.2 | -7.76 | -15.1 | -8.60 | -65.0 | |||||||||||
| Effect of FX Rates | CHF mil | -2.93 | 3.40 | -1.75 | -5.80 | 1.21 | ... | ... | ... | ... | ... | ||||||
| Net Change In Cash | CHF mil | 20.1 | -33.3 | -8.87 | -33.6 | -10.6 | |||||||||||
| ratios | |||||||||||||||||
| Days Sales Outstanding | days | 45.6 | 56.4 | 45.9 | 37.2 | 45.0 | |||||||||||
| Days Sales Of Inventory | days | 73.4 | 97.1 | 89.4 | 66.9 | 52.1 | |||||||||||
| Days Payable Outstanding | days | 33.7 | 36.4 | 44.1 | 35.4 | 41.4 | |||||||||||
| Cash Conversion Cycle | days | 85.3 | 117 | 91.2 | 68.7 | 55.7 | |||||||||||
| Cash Earnings | CHF mil | 60.5 | 47.8 | 26.9 | -52.4 | 26.8 | |||||||||||
| Free Cash Flow | CHF mil | -4.16 | -29.0 | 7.99 | -19.2 | 53.2 | |||||||||||
| Capital Expenditures (As % of Sales) | % | 16.1 | 15.6 | 14.8 | 12.8 | 10.4 |
| other ratios | Unit | 2011 | 2012 | 2013 | 2014 | 2015 | 2016 | 2017 | 2018 | 2019 | 2020 | 2021 | 2022 | 2023 | 2024 | 2025 | 2026 |
| Employees | 947 | ... | ... | ... | ... | ... | ... | ... | ... | ... | |||||||
| Cost Per Employee | USD per month | 6,230 | ... | ... | ... | ... | ... | ... | ... | ... | ... | ||||||
| Cost Per Employee (Local Currency) | CHF per month | 6,203 | ... | ... | ... | ... | ... | ... | ... | ... | ... | ||||||
| Operating Cost (As % of Sales) | % | 29.9 | 33.7 | 40.6 | 65.0 | 41.7 | ... | ... | ... | ... | ... | ||||||
| Research & Development (As % of Sales) | % | 16.2 | 19.1 | 25.0 | 48.1 | 25.7 | ... | ... | ... | ... | ... | ||||||
| Staff Cost (As % of Sales) | % | 17.5 | 17.8 | 20.4 | 27.2 | 26.0 | ... | ... | ... | ... | ... | ||||||
| Effective Tax Rate | % | 20.8 | 20.0 | 9.18 | 17.9 | 27.2 | |||||||||||
| Total Revenue Growth (5-year average) | % | ... | ... | ... | ... | ... | 18.5 | 12.3 | 7.36 | -0.287 | 2.82 | ||||||
| Total Revenue Growth (10-year average) | % | ... | ... | ... | ... | ... | ... | ... | ... | ... | ... | 12.8 |
| valuation | Unit | 2011 | 2012 | 2013 | 2014 | 2015 | 2016 | 2017 | 2018 | 2019 | 2020 | 2021 | 2022 | 2023 | 2024 | 2025 | 2026 |
| Market Capitalisation | USD mil | ... | ... | ... | ... | ... | ... | 1,374 | 557 | 711 | 461 | 535 | |||||
| Enterprise Value (EV) | USD mil | ... | ... | ... | ... | ... | ... | 1,319 | 538 | 724 | 528 | 545 | |||||
| Number Of Shares | mil | ... | ... | ... | ... | ... | ... | 6.98 | 6.92 | 6.92 | 6.94 | 6.94 | |||||
| Share Price | CHF | ... | ... | ... | ... | ... | ... | 192 | 79.0 | 99.2 | 58.9 | 70.5 | |||||
| EV/EBITDA | ... | ... | ... | ... | ... | ... | 15.1 | 7.36 | 13.4 | -12.6 | 7.43 | ||||||
| Price/Earnings (P/E) | ... | ... | ... | ... | ... | ... | 26.1 | 14.2 | 52.6 | -6.32 | 31.9 | ||||||
| Price/Cash Earnings (P/CE) | ... | ... | ... | ... | ... | ... | 22.1 | 11.4 | 25.5 | -7.79 | 18.2 | ||||||
| P/FCF | ... | ... | ... | ... | ... | ... | -322 | -18.9 | 86.0 | -21.3 | 9.19 | ||||||
| Price/Book Value (P/BV) | ... | ... | ... | ... | ... | ... | 4.21 | 1.57 | 1.95 | 1.44 | 1.62 | ||||||
| Dividend Yield | % | ... | ... | ... | ... | ... | ... | 1.08 | 2.86 | 1.62 | 1.02 | 0.852 | |||||
| Free Cash Flow Yield | % | ... | ... | ... | ... | ... | ... | -0.304 | -5.31 | 1.15 | -4.49 | 11.1 | |||||
| Earnings Per Share (EPS) | CHF | ... | ... | ... | ... | ... | ... | 7.34 | 5.56 | 1.89 | -9.32 | 2.21 | |||||
| Cash Earnings Per Share | CHF | ... | ... | ... | ... | ... | ... | 8.67 | 6.90 | 3.89 | -7.55 | 3.86 | |||||
| Free Cash Flow Per Share | CHF | ... | ... | ... | ... | ... | ... | -0.596 | -4.18 | 1.15 | -2.76 | 7.67 | |||||
| Book Value Per Share | CHF | ... | ... | ... | ... | ... | ... | 45.6 | 50.4 | 50.8 | 40.8 | 43.5 | |||||
| Dividend Per Share | CHF | ... | ... | ... | ... | ... | ... | 2.08 | 2.26 | 1.60 | 0.600 | 0.600 | |||||
| EV/Sales | ... | ... | ... | ... | ... | ... | 3.25 | 1.34 | 1.84 | 1.46 | 1.18 | ||||||
| EV/EBIT | ... | ... | ... | ... | ... | ... | 20.2 | 10.9 | 32.1 | -7.54 | 18.9 | ||||||
| EV/Free Cash Flow | ... | ... | ... | ... | ... | ... | -316 | -18.2 | 88.6 | -25.5 | 9.19 | ||||||
| EV/Capital Employed | ... | ... | ... | ... | ... | ... | 4.08 | 1.42 | 1.75 | 1.34 | 1.38 | ||||||
| Earnings Per Share Growth | % | ... | ... | ... | ... | ... | ... | ... | -24.3 | -66.1 | -594 | -124 | |||||
| Cash Earnings Per Share Growth | % | ... | ... | ... | ... | ... | ... | ... | -20.4 | -43.6 | -294 | -151 | |||||
| Book Value Per Share Growth | % | ... | ... | ... | ... | ... | ... | ... | 10.4 | 0.769 | -19.7 | 6.84 |
Get all company financials in excel:


By Helgi Library - August 26, 2022
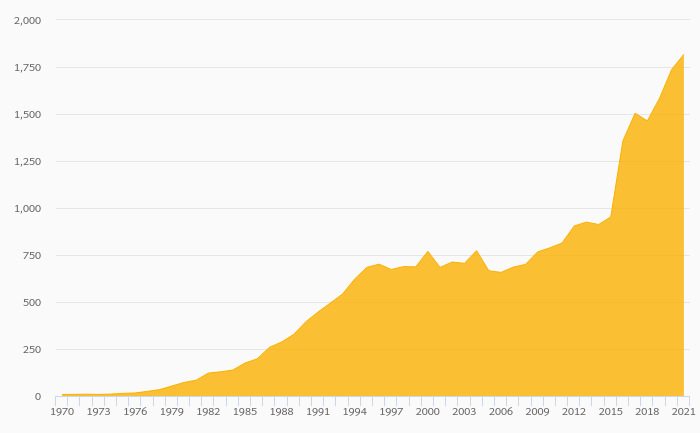
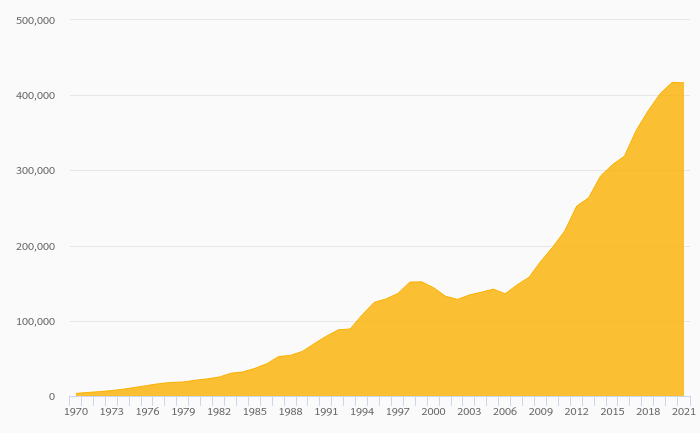
u-Blox Holding made a net profit of CHF 15.3 mil in 2021, up 124% compared to the previous year. Historically, between 2011 and 2021, the company's net profit reached a high of CHF 51.3 mil in 2017 and a low of CHF -64.6 mil in 2020. The result implies a ...
By Helgi Library - August 26, 2022
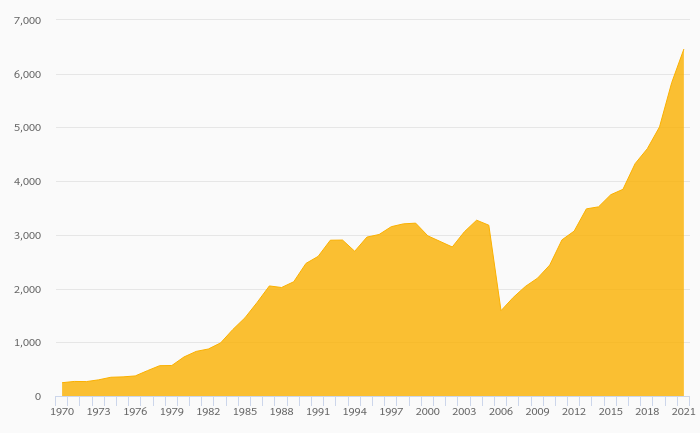
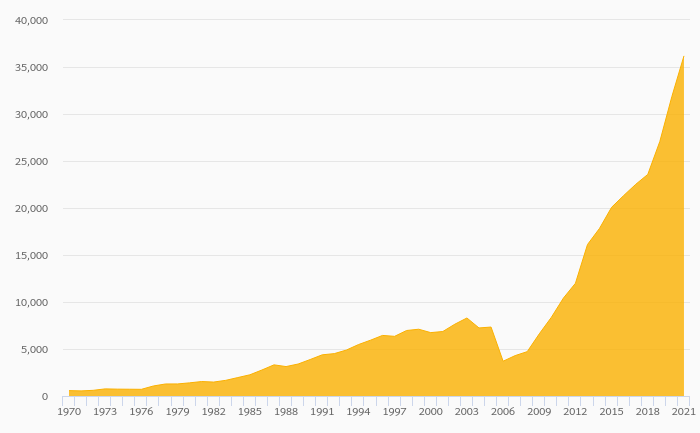
u-Blox Holding invested a total of CHF 43.1 mil in 2021, up 0.892% compared to the previous year. Historically, between 2011 - 2021, the company's investments stood at a high of CHF 64.9 mil in 2017 and a low of CHF 10.5 mil in 2011. ...
By Helgi Library - August 26, 2022
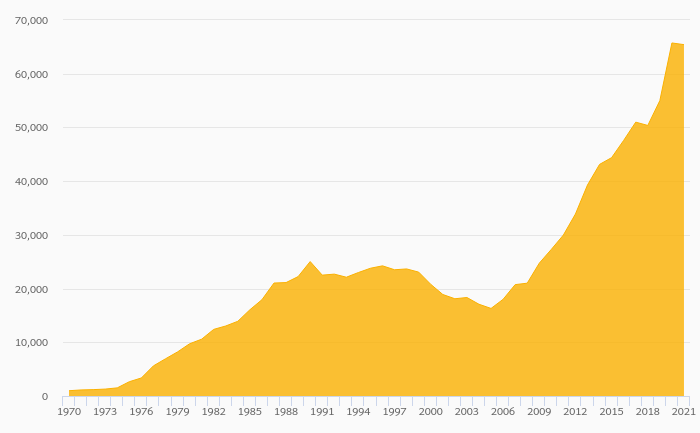
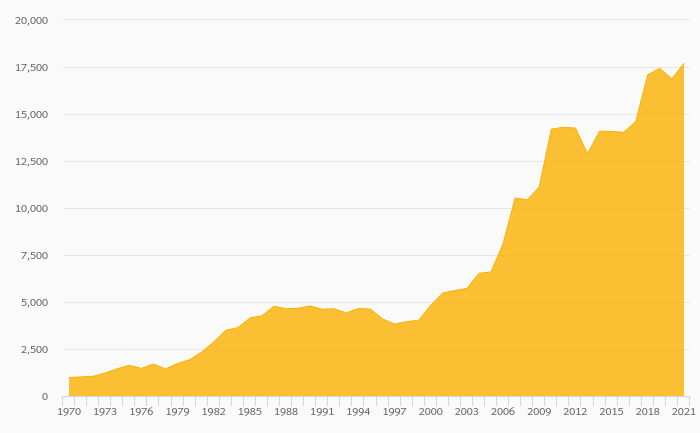
u-Blox Holding made a net profit of CHF 15.3 mil with revenues of CHF 414 mil in 2021, up by 124% and up by 24.2%, respectively, compared to the previous year. This translates into a net margin of 3.70%. Historically, between 2011 and 2021, the firm...
By Helgi Library - August 26, 2022
u-Blox Holding stock traded at CHF 70.5 per share at the end 2021 implying a market capitalization of USD 535 mil. Since the end of 2016, stock has appreciated by % implying an annual average growth of % In absolute terms, the value of the company rose ...
By Helgi Library - August 26, 2022
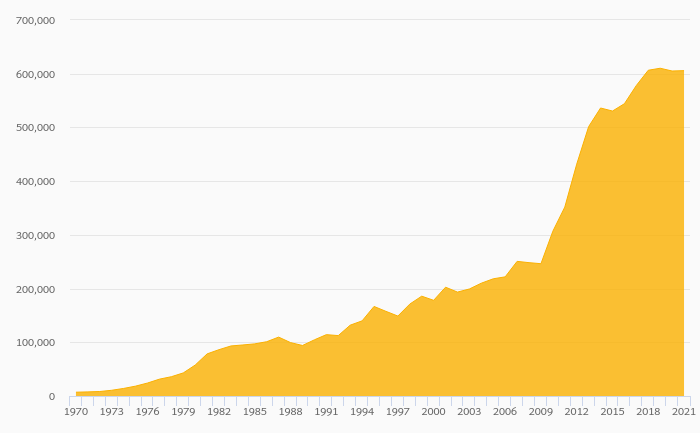
u-Blox Holding stock traded at CHF 70.5 per share at the end 2021 translating into a market capitalization of USD 535 mil. Since the end of 2016, the stock has appreciated by 0% representing an annual average growth of %. At the end of 2021, the firm tra...
By Helgi Library - August 26, 2022
u-Blox Holding employed 947 employees in 2017, up 20.5% compared to the previous year. Historically, between 2011 and 2017, the firm's workforce hit a high of 947 employees in 2017 and a low of 229 employees in 2011. Average personnel cost stood at U...

u-Blox Holding has been growing its sales by 11.3% a year on average in the last 5 years. EBITDA has grown on average by 14.7% a year during that time to total of CHF 131 mil in 2026, or 18.4% of sales. That’s compared to 17.5% average margin seen in last five years.
The company netted CHF 65.1 mil in 2026 implying ROE of 13.8% and ROCE of 15.4%. Again, the average figures were 11.8% and 11.7%, respectively when looking at the previous 5 years.
u-Blox Holding’s net debt amounted to CHF 57.8 mil at the end of 2026, or 11.7% of equity. When compared to EBITDA, net debt was 0.443x, up when compared to average of 0.335x seen in the last 5 years.
u-Blox Holding stock traded at CHF 134 per share at the end of 2026 resulting in a market capitalization of USD 1,017 mil. Over the previous five years, stock price grew by 89.90000000000001% or 13.7% a year on average. The closing price put stock at a 12-month trailing EV/EBITDA of 7.56x and price to earnings (PE) of 14.3x as of 2026.
 Helgi Library