By Helgi Library - April 2, 2020
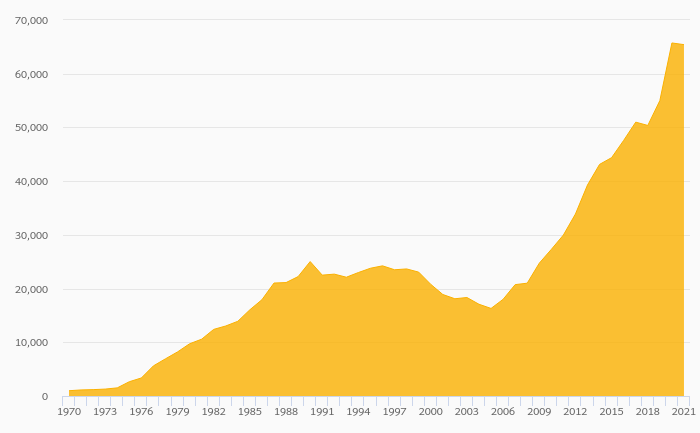
Andritz's total assets reached EUR 5,968 mil at the end of 2014, up 7.11% compared to the previous year. Current a...
| Profit Statement |
| Balance Sheet |
| Ratios |
| Valuation |
Get all company financials in excel:
Get all company financials in excel:


Andritz AG is an Austria-based supplier of plants, equipment, and services for hydropower stations, the pulp and paper industry, the metalworking and steel industries, and solid/liquid separation in the municipal and industrial sectors. In addition, the Company offers technologies for certain other sectors including automation, the production of animal feed and biomass pellets, pumps, machinery for nonwovens and plastic films, or steam boiler plants, for example. Andritz's business is divided into five business segments: Hydro, Pulp & Paper, Metals, Separation and Feed & Biofuel. The Group got its name from the district Andritz in Austria in which it is located. Andritz employs more than 23,400 employees at over 220 production and service facilities
Andritz has been growing its sales by a year on average in the last 5 years. EBITDA has grown by 0% during that time to total of in 2015, or of sales. That’s compared to 7.25% average margin seen in last five years.
The company netted in 2015 implying ROE of and ROCE of . Again, the average figures were 19.9% and 9.36%, respectively when looking at the previous 5 years.
Andritz’s net debt amounted to at the end of 2015, or of equity. When compared to EBITDA, net debt was x, up when compared to average of -1.90x seen in the last 5 years.
Andritz stock traded at EUR 45.1 per share at the end of 2015 resulting in a market capitalization of . Over the previous five years, stock price grew by 31% or 5.55% a year on average. The closing price put stock at a 12-month trailing EV/EBITDA of x and price to earnings (PE) of x as of 2015.
 Helgi Library