By Helgi Library - May 12, 2024
CSOB Stavebni Sporitelna's loans reached CZK 122,667 mil in the fourth quarter of 2023, up from CZK 122,166 mil when compare...
By Helgi Library - May 12, 2024
CSOB Stavebni Sporitelna's capital adequacy ratio reached 31.2% at the end of fourth quarter of 2023, up from 24.3% when compared...
By Helgi Library - May 12, 2024
CSOB Stavebni Sporitelna generated total banking revenues of CZK 436 mil in 2023-12-31, down 36.6% compared to the previous year...
| Profit Statement | 2021 | 2022 | 2023 | |
| Net Interest Income | CZK mil | 1,139 | 2,356 | 2,218 |
| Net Fee Income | CZK mil | 562 | 480 | 426 |
| Other Income | CZK mil | -32.3 | -10.0 | -184 |
| Total Revenues | CZK mil | 1,669 | 2,827 | 2,460 |
| Staff Cost | CZK mil | 242 | 245 | 271 |
| Operating Profit | CZK mil | 397 | 1,559 | 1,200 |
| Provisions | CZK mil | -445 | -96.5 | 0.223 |
| Net Profit | CZK mil | 680 | 1,338 | 993 |
| Balance Sheet | 2021 | 2022 | 2023 | |
| Interbank Loans | CZK mil | 13,508 | 0 | 0 |
| Customer Loans | CZK mil | 123,203 | 124,329 | 121,069 |
| Investments | CZK mil | 6,598 | 5,802 | 5,903 |
| Total Assets | CZK mil | 150,909 | 137,368 | 134,829 |
| Shareholders' Equity | CZK mil | 8,420 | 9,227 | 9,897 |
| Interbank Borrowing | CZK mil | 0 | 0 | 0 |
| Customer Deposits | CZK mil | 141,894 | 126,972 | 122,698 |
| Issued Debt Securities | CZK mil | 0 | 0 | 0 |
| Ratios | 2021 | 2022 | 2023 | |
| ROE | % | 8.83 | 15.2 | 10.4 |
| ROA | % | 0.452 | 0.928 | 0.729 |
| Costs (As % Of Assets) | % | 0.846 | 0.880 | 0.926 |
| Costs (As % Of Income) | % | 76.2 | 44.9 | 51.2 |
| Capital Adequacy Ratio | % | 21.3 | 25.5 | 31.2 |
| Net Interest Margin | % | 0.758 | 1.63 | 1.63 |
| Loans (As % Of Deposits) | % | 86.8 | 97.9 | 98.7 |
| NPLs (As % Of Loans) | % | 1.92 | 1.55 | 1.61 |
| Provisions (As % Of NPLs) | % | 75.1 | 85.2 | 80.8 |
| Growth Rates | 2021 | 2022 | 2023 | |
| Total Revenue Growth | % | -27.9 | 69.3 | -13.0 |
| Operating Cost Growth | % | -3.63 | -0.312 | -0.652 |
| Operating Profit Growth | % | -60.1 | 292 | -23.0 |
| Net Profit Growth | % | 37.9 | 96.8 | -25.8 |
| Customer Loan Growth | % | -2.13 | 0.914 | -2.62 |
| Total Asset Growth | % | 0.725 | -8.97 | -1.85 |
| Customer Deposit Growth | % | 0.816 | -10.5 | -3.37 |
| Shareholders' Equity Growth | % | 20.5 | 9.58 | 7.25 |
| Employees | 188 | 186 | 184 | |
Get all company financials in excel:
| summary | Unit | 2000 | 2001 | 2002 | 2003 | 2004 | 2005 | 2006 | 2007 | 2008 | 2009 | 2010 | 2011 | 2012 | 2013 | 2014 | 2015 | 2016 | 2017 | 2018 | 2019 | 2020 | 2021 | 2022 | 2023 |
| income statement | |||||||||||||||||||||||||
| Net Interest Income | CZK mil | 2,173 | 1,969 | 2,138 | 1,711 | 1,139 | |||||||||||||||||||
| Total Revenues | CZK mil | 2,789 | 2,581 | 2,776 | 2,317 | 1,669 | |||||||||||||||||||
| Operating Profit | CZK mil | 1,434 | 1,266 | 1,391 | 997 | 397 | |||||||||||||||||||
| Net Profit | CZK mil | 1,043 | 873 | 965 | 493 | 680 | |||||||||||||||||||
| balance sheet | |||||||||||||||||||||||||
| Interbank Loans | CZK mil | 3,616 | 4,043 | 19.4 | 56.8 | 13,508 | |||||||||||||||||||
| Customer Loans | CZK mil | 115,310 | 117,338 | 120,383 | 125,879 | 123,203 | |||||||||||||||||||
| Investments | CZK mil | 8,262 | 21,614 | 4,783 | 5,289 | 6,598 | |||||||||||||||||||
| Total Assets | CZK mil | 149,193 | 148,070 | 147,415 | 149,823 | 150,909 | |||||||||||||||||||
| Shareholders' Equity | CZK mil | 9,146 | 8,559 | 7,255 | 6,986 | 8,420 | |||||||||||||||||||
| Interbank Borrowing | CZK mil | 40.3 | 0 | 0 | 0 | 0 | |||||||||||||||||||
| Customer Deposits | CZK mil | 138,845 | 137,901 | 139,049 | 140,746 | 141,894 | |||||||||||||||||||
| Issued Debt Securities | CZK mil | 0 | 0 | 0 | 0 | 0 | |||||||||||||||||||
| ratios | |||||||||||||||||||||||||
| ROE | % | ... | 11.0 | 9.86 | 12.2 | 6.93 | 8.83 | ||||||||||||||||||
| ROA | % | ... | 0.698 | 0.587 | 0.653 | 0.332 | 0.452 | ||||||||||||||||||
| Costs (As % Of Assets) | % | ... | 0.907 | 0.885 | 0.938 | 0.888 | 0.846 | ||||||||||||||||||
| Costs (As % Of Income) | % | 48.6 | 51.0 | 49.9 | 57.0 | 76.2 | |||||||||||||||||||
| Capital Adequacy Ratio | % | ... | ... | 20.5 | 17.5 | 18.6 | 17.7 | 21.3 | |||||||||||||||||
| Net Interest Margin | % | ... | 1.46 | 1.32 | 1.45 | 1.15 | 0.758 | ||||||||||||||||||
| Interest Income (As % Of Revenues) | % | 77.9 | 76.3 | 77.0 | 73.8 | 68.2 | |||||||||||||||||||
| Fee Income (As % Of Revenues) | % | 21.9 | 24.6 | 22.0 | 24.3 | 33.7 | |||||||||||||||||||
| Staff Cost (As % Of Total Cost) | % | 40.3 | 39.3 | 37.9 | 30.5 | 19.1 | |||||||||||||||||||
| Equity (As % Of Assets) | % | 6.13 | 5.78 | 4.92 | 4.66 | 5.58 | |||||||||||||||||||
| Loans (As % Of Deposits) | % | 83.0 | 85.1 | 86.6 | 89.4 | 86.8 | |||||||||||||||||||
| Loans (As % Assets) | % | 77.3 | 79.2 | 81.7 | 84.0 | 81.6 | |||||||||||||||||||
| NPLs (As % Of Loans) | % | 2.24 | 4.36 | 3.14 | 2.28 | 1.92 | |||||||||||||||||||
| Provisions (As % Of NPLs) | % | 84.3 | 41.9 | 61.4 | 75.6 | 75.1 | |||||||||||||||||||
| valuation | |||||||||||||||||||||||||
| Book Value Per Share Growth | % | ... | -11.8 | -9.40 | 8.59 | -20.0 | -33.4 |
| income statement | Unit | 2000 | 2001 | 2002 | 2003 | 2004 | 2005 | 2006 | 2007 | 2008 | 2009 | 2010 | 2011 | 2012 | 2013 | 2014 | 2015 | 2016 | 2017 | 2018 | 2019 | 2020 | 2021 | 2022 | 2023 |
| income statement | |||||||||||||||||||||||||
| Interest Income | CZK mil | 4,456 | 4,232 | 4,248 | 3,929 | 3,645 | |||||||||||||||||||
| Interest Cost | CZK mil | 2,282 | 2,263 | 2,110 | 2,218 | 2,506 | |||||||||||||||||||
| Net Interest Income | CZK mil | 2,173 | 1,969 | 2,138 | 1,711 | 1,139 | |||||||||||||||||||
| Net Fee Income | CZK mil | 612 | 634 | 611 | 562 | 562 | |||||||||||||||||||
| Fee Income | CZK mil | ... | ... | ... | ... | ... | ... | ... | ... | ... | ... | ... | ... | ... | ... | ... | ... | ... | ... | ... | 995 | 1,007 | 1,091 | ||
| Fee Expense | CZK mil | ... | ... | ... | ... | ... | ... | ... | ... | ... | ... | ... | ... | ... | ... | ... | ... | ... | ... | ... | 384 | 445 | 529 | ||
| Other Income | CZK mil | 3.59 | -22.3 | 26.9 | 44.0 | -32.3 | |||||||||||||||||||
| Total Revenues | CZK mil | 2,789 | 2,581 | 2,776 | 2,317 | 1,669 | |||||||||||||||||||
| Staff Cost | CZK mil | 546 | 517 | 526 | 403 | 242 | |||||||||||||||||||
| Depreciation | CZK mil | 255 | 281 | 309 | 272 | 278 | |||||||||||||||||||
| Other Cost | CZK mil | 553 | 518 | 550 | 645 | 751 | |||||||||||||||||||
| Operating Cost | CZK mil | 1,354 | 1,315 | 1,385 | 1,320 | 1,272 | |||||||||||||||||||
| Operating Profit | CZK mil | 1,434 | 1,266 | 1,391 | 997 | 397 | |||||||||||||||||||
| Provisions | CZK mil | 183 | 182 | 184 | 385 | -445 | |||||||||||||||||||
| Extra and Other Cost | CZK mil | 0 | 0 | 0 | 0 | 0 | |||||||||||||||||||
| Pre-Tax Profit | CZK mil | 1,252 | 1,083 | 1,207 | 612 | 843 | |||||||||||||||||||
| Tax | CZK mil | 209 | 210 | 242 | 119 | 162 | |||||||||||||||||||
| Minorities | CZK mil | 0 | 0 | 0 | 0 | 0 | |||||||||||||||||||
| Net Profit | CZK mil | 1,043 | 873 | 965 | 493 | 680 | |||||||||||||||||||
| Net Profit Avail. to Common | CZK mil | 1,043 | 873 | 965 | 493 | 680 | |||||||||||||||||||
| Dividends | CZK mil | ... | 1,638 | 1,461 | 2,268 | 493 | 680 | ... | |||||||||||||||||
| growth rates | |||||||||||||||||||||||||
| Net Interest Income Growth | % | ... | -11.8 | -9.40 | 8.59 | -20.0 | -33.4 | ||||||||||||||||||
| Net Fee Income Growth | % | ... | 1.84 | 3.61 | -3.57 | -8.07 | 0.086 | ||||||||||||||||||
| Total Revenue Growth | % | ... | -9.41 | -7.46 | 7.58 | -16.6 | -27.9 | ||||||||||||||||||
| Operating Cost Growth | % | ... | -1.39 | -2.90 | 5.36 | -4.74 | -3.63 | ||||||||||||||||||
| Operating Profit Growth | % | ... | -15.9 | -11.8 | 9.89 | -28.3 | -60.1 | ||||||||||||||||||
| Pre-Tax Profit Growth | % | ... | -13.9 | -13.5 | 11.4 | -49.3 | 37.7 | ||||||||||||||||||
| Net Profit Growth | % | ... | -11.3 | -16.3 | 10.5 | -48.9 | 37.9 | ||||||||||||||||||
| market share | |||||||||||||||||||||||||
| Market Share in Revenues | % | 1.56 | 1.36 | 1.37 | 1.28 | 0.905 | |||||||||||||||||||
| Market Share in Net Profit | % | 1.38 | 1.07 | 1.06 | 1.04 | 0.967 | |||||||||||||||||||
| Market Share in Employees | % | 1.27 | 1.22 | 1.09 | 0.580 | 0.473 | |||||||||||||||||||
| Market Share in Branches | % | ... | ... | ... | ... | ... | ... | ... | ... | ... | ... | ... | ... | ... | ... | 15.5 | 15.2 | 14.4 | 15.6 | 15.4 |
| balance sheet | Unit | 2000 | 2001 | 2002 | 2003 | 2004 | 2005 | 2006 | 2007 | 2008 | 2009 | 2010 | 2011 | 2012 | 2013 | 2014 | 2015 | 2016 | 2017 | 2018 | 2019 | 2020 | 2021 | 2022 | 2023 |
| balance sheet | |||||||||||||||||||||||||
| Cash & Cash Equivalents | CZK mil | 22,346 | 20,501 | 20,773 | 13,905 | 1,281 | |||||||||||||||||||
| Interbank Loans | CZK mil | 3,616 | 4,043 | 19.4 | 56.8 | 13,508 | |||||||||||||||||||
| Customer Loans | CZK mil | 115,310 | 117,338 | 120,383 | 125,879 | 123,203 | |||||||||||||||||||
| Retail Loans | CZK mil | 115,310 | 117,338 | 120,383 | 122,371 | 124,571 | |||||||||||||||||||
| Mortgage Loans | CZK mil | 115,310 | 117,338 | 120,383 | 122,371 | 124,571 | |||||||||||||||||||
| Consumer Loans | CZK mil | 0 | 0 | 0 | 0 | 0 | |||||||||||||||||||
| Corporate Loans | CZK mil | ... | ... | ... | ... | ... | ... | ... | ... | ... | ... | ... | ... | ... | ... | ... | ... | ... | ... | ... | ... | ... | 438 | ||
| Investments | CZK mil | 8,262 | 21,614 | 4,783 | 5,289 | 6,598 | |||||||||||||||||||
| Property and Equipment | CZK mil | 1,655 | 1,637 | 511 | 201 | 120 | |||||||||||||||||||
| Intangible Assets | CZK mil | ... | ... | ... | ... | ... | ... | ... | ... | ... | ... | ... | ... | ... | ... | ... | ... | ... | ... | ... | 945 | 784 | 631 | ||
| Goodwill | CZK mil | ... | ... | ... | ... | ... | ... | ... | ... | ... | ... | ... | ... | ... | ... | ... | ... | ... | ... | ... | 0 | 0 | 0 | ||
| Total Assets | CZK mil | 149,193 | 148,070 | 147,415 | 149,823 | 150,909 | |||||||||||||||||||
| Shareholders' Equity | CZK mil | 9,146 | 8,559 | 7,255 | 6,986 | 8,420 | |||||||||||||||||||
| Of Which Minority Interest | CZK mil | 0 | 0 | 0 | 0 | 0 | |||||||||||||||||||
| Liabilities | CZK mil | 140,047 | 139,511 | 140,160 | 142,837 | 142,488 | |||||||||||||||||||
| Interbank Borrowing | CZK mil | 40.3 | 0 | 0 | 0 | 0 | |||||||||||||||||||
| Customer Deposits | CZK mil | 138,845 | 137,901 | 139,049 | 140,746 | 141,894 | |||||||||||||||||||
| Retail Deposits | CZK mil | 138,845 | 137,901 | 139,049 | 140,746 | 141,894 | |||||||||||||||||||
| Corporate Deposits | CZK mil | 0 | 0 | 0 | 0 | 0 | |||||||||||||||||||
| Sight Deposits | CZK mil | ... | ... | ... | ... | ... | ... | ... | ... | ... | ... | ... | ... | ... | ... | ... | ... | ... | ... | ... | ... | ... | 26.5 | ||
| Term Deposits | CZK mil | ... | ... | ... | ... | ... | ... | ... | ... | ... | ... | ... | ... | ... | ... | ... | ... | ... | ... | ... | ... | ... | 141,867 | ||
| Issued Debt Securities | CZK mil | 0 | 0 | 0 | 0 | 0 | |||||||||||||||||||
| Other Liabilities | CZK mil | 1,161 | 1,610 | 1,111 | 2,092 | 594 | |||||||||||||||||||
| asset quality | |||||||||||||||||||||||||
| Non-Performing Loans | CZK mil | 2,569 | 5,210 | 3,838 | 3,091 | 2,405 | |||||||||||||||||||
| Gross Loans | CZK mil | 114,730 | 119,520 | 122,338 | 135,534 | 125,009 | |||||||||||||||||||
| Risk-Weighted Assets | CZK mil | ... | ... | 44,551 | 42,421 | 39,027 | 34,740 | 34,894 | |||||||||||||||||
| Total Provisions | CZK mil | 2,165 | 2,182 | 2,357 | 2,338 | 1,806 | |||||||||||||||||||
| growth rates | |||||||||||||||||||||||||
| Customer Loan Growth | % | ... | -2.54 | 1.76 | 2.60 | 4.56 | -2.13 | ||||||||||||||||||
| Retail Loan Growth | % | ... | -2.54 | 1.76 | 2.60 | 1.65 | 1.80 | ||||||||||||||||||
| Mortgage Loan Growth | % | ... | -2.54 | 1.76 | 2.60 | 1.65 | 1.80 | ||||||||||||||||||
| Corporate Loan Growth | % | ... | ... | ... | ... | ... | ... | ... | ... | ... | ... | ... | ... | ... | ... | ... | ... | ... | ... | ... | ... | ... | ... | ||
| Total Asset Growth | % | ... | -0.229 | -0.753 | -0.442 | 1.63 | 0.725 | ||||||||||||||||||
| Shareholders' Equity Growth | % | ... | -6.10 | -6.43 | -15.2 | -3.72 | 20.5 | ||||||||||||||||||
| Customer Deposit Growth | % | ... | 0.272 | -0.680 | 0.832 | 1.22 | 0.816 | ||||||||||||||||||
| Retail Deposit Growth | % | ... | 0.272 | -0.680 | 0.832 | 1.22 | 0.816 | ||||||||||||||||||
| market share | |||||||||||||||||||||||||
| Market Share in Customer Loans | % | 3.74 | 3.55 | 3.49 | 3.50 | 3.20 | ... | ||||||||||||||||||
| Market Share in Corporate Loans | % | ... | ... | ... | ... | ... | ... | ... | ... | ... | ... | ... | ... | ... | ... | ... | ... | ... | ... | ... | ... | ... | 0.037 | ||
| Market Share in Retail Loans | % | 7.55 | 7.14 | 6.90 | 6.58 | 6.10 | |||||||||||||||||||
| Market Share in Consumer Loans | % | 0 | 0 | 0 | 0 | 0 | |||||||||||||||||||
| Market Share in Mortgage Loans | % | 10.0 | 9.42 | 9.05 | 8.52 | 7.81 | |||||||||||||||||||
| Market Share in Total Assets | % | 2.13 | 2.03 | 1.95 | 1.88 | 1.77 | |||||||||||||||||||
| Market Share in Customer Deposits | % | 3.33 | 3.10 | 2.93 | 2.73 | 2.58 | |||||||||||||||||||
| Market Share in Retail Deposits | % | 5.86 | 5.39 | 5.10 | 4.60 | 4.35 | |||||||||||||||||||
| Market Share in Corporate Deposits | % | 0 | 0 | 0 | 0 | 0 |
| ratios | Unit | 2000 | 2001 | 2002 | 2003 | 2004 | 2005 | 2006 | 2007 | 2008 | 2009 | 2010 | 2011 | 2012 | 2013 | 2014 | 2015 | 2016 | 2017 | 2018 | 2019 | 2020 | 2021 | 2022 | 2023 |
| ROE | % | ... | 11.0 | 9.86 | 12.2 | 6.93 | 8.83 | ||||||||||||||||||
| ROTE | % | ... | ... | ... | ... | ... | ... | ... | ... | ... | ... | ... | ... | ... | ... | ... | ... | ... | ... | ... | ... | 7.88 | 9.72 | ||
| ROE (@ 15% of RWA) | % | ... | ... | ... | 15.1 | 13.4 | 15.8 | 8.91 | 13.0 | ||||||||||||||||
| ROA | % | ... | 0.698 | 0.587 | 0.653 | 0.332 | 0.452 | ||||||||||||||||||
| Return on Loans | % | 0.893 | 0.751 | 0.812 | 0.401 | 0.546 | |||||||||||||||||||
| Operating Profit (As % of RWA) | % | ... | ... | ... | 3.12 | 2.91 | 3.42 | 2.70 | 1.14 | ||||||||||||||||
| Costs (As % Of Assets) | % | ... | 0.907 | 0.885 | 0.938 | 0.888 | 0.846 | ||||||||||||||||||
| Costs (As % Of Income) | % | 48.6 | 51.0 | 49.9 | 57.0 | 76.2 | |||||||||||||||||||
| Costs (As % Of Loans) | % | ... | 1.16 | 1.13 | 1.17 | 1.07 | 1.02 | ||||||||||||||||||
| Costs (As % Of Loans & Deposits) | % | ... | 0.530 | 0.516 | 0.538 | 0.502 | 0.478 | ||||||||||||||||||
| Capital Adequacy Ratio | % | ... | ... | 20.5 | 17.5 | 18.6 | 17.7 | 21.3 | |||||||||||||||||
| Tier 1 Ratio | % | ... | ... | 20.5 | 17.5 | 18.5 | 16.7 | 20.7 | |||||||||||||||||
| Net Interest Margin | % | ... | 1.46 | 1.32 | 1.45 | 1.15 | 0.758 | ||||||||||||||||||
| Interest Spread | % | ... | 1.35 | 1.23 | 1.37 | 1.08 | 0.668 | ||||||||||||||||||
| Asset Yield | % | ... | 2.98 | 2.85 | 2.88 | 2.64 | 2.42 | ||||||||||||||||||
| Revenues (As % of RWA) | % | ... | ... | ... | 6.06 | 5.93 | 6.82 | 6.28 | 4.79 | ||||||||||||||||
| Cost Of Liabilities | % | ... | 1.63 | 1.62 | 1.51 | 1.57 | 1.76 | ||||||||||||||||||
| Payout Ratio | % | ... | 157 | 167 | 235 | 100 | 100 | ... | |||||||||||||||||
| Interest Income (As % Of Revenues) | % | 77.9 | 76.3 | 77.0 | 73.8 | 68.2 | |||||||||||||||||||
| Fee Income (As % Of Revenues) | % | 21.9 | 24.6 | 22.0 | 24.3 | 33.7 | |||||||||||||||||||
| Other Income (As % Of Revenues) | % | 0.129 | -0.864 | 0.970 | 1.90 | -1.93 | |||||||||||||||||||
| Staff Cost (As % Of Total Cost) | % | 40.3 | 39.3 | 37.9 | 30.5 | 19.1 | |||||||||||||||||||
| Equity (As % Of Assets) | % | 6.13 | 5.78 | 4.92 | 4.66 | 5.58 | |||||||||||||||||||
| Equity (As % Of Loans) | % | 7.93 | 7.29 | 6.03 | 5.55 | 6.83 | |||||||||||||||||||
| Loans (As % Of Deposits) | % | 83.0 | 85.1 | 86.6 | 89.4 | 86.8 | |||||||||||||||||||
| Loans (As % Assets) | % | 77.3 | 79.2 | 81.7 | 84.0 | 81.6 | |||||||||||||||||||
| NPLs (As % Of Loans) | % | 2.24 | 4.36 | 3.14 | 2.28 | 1.92 | |||||||||||||||||||
| Provisions (As % Of NPLs) | % | 84.3 | 41.9 | 61.4 | 75.6 | 75.1 | |||||||||||||||||||
| Provisions (As % Of Loans) | % | 1.88 | 1.86 | 1.96 | 1.86 | 1.47 | |||||||||||||||||||
| Cost of Provisions (As % Of Loans) | % | ... | 0.156 | 0.157 | 0.155 | 0.313 | -0.357 |
| other data | Unit | 2000 | 2001 | 2002 | 2003 | 2004 | 2005 | 2006 | 2007 | 2008 | 2009 | 2010 | 2011 | 2012 | 2013 | 2014 | 2015 | 2016 | 2017 | 2018 | 2019 | 2020 | 2021 | 2022 | 2023 |
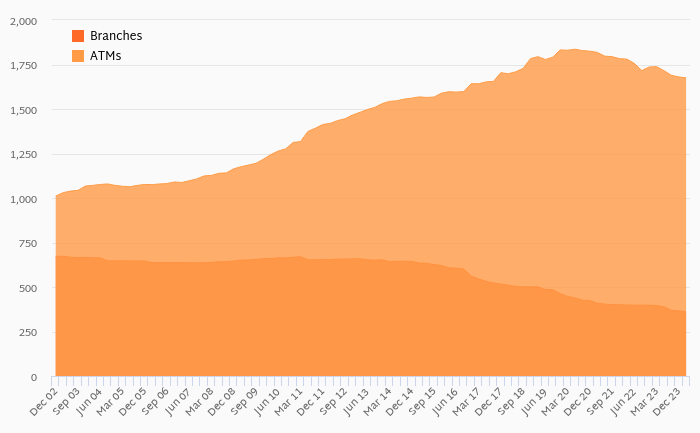
| Branches | ... | ... | ... | ... | ... | ... | ... | ... | ... | ... | ... | ... | ... | ... | 302 | 297 | 273 | 262 | 246 | ||||||
| Employees | 530 | 512 | 452 | 236 | 188 | ||||||||||||||||||||
| Employees Per Bank Branch | ... | ... | ... | ... | ... | ... | ... | ... | ... | ... | ... | ... | ... | ... | 1.75 | 1.72 | 1.66 | 0.901 | 0.764 | ||||||
| Cost Per Employee | USD per month | 3,658 | 3,844 | 4,298 | 6,464 | 4,958 | |||||||||||||||||||
| Cost Per Employee (Local Currency) | CZK per month | 85,824 | 84,104 | 96,895 | 142,226 | 107,437 |
| customer breakdown | Unit | 2000 | 2001 | 2002 | 2003 | 2004 | 2005 | 2006 | 2007 | 2008 | 2009 | 2010 | 2011 | 2012 | 2013 | 2014 | 2015 | 2016 | 2017 | 2018 | 2019 | 2020 | 2021 | 2022 | 2023 |
| Customers | mil | 1.36 | 1.32 | 1.31 | 1.30 | 1.28 | |||||||||||||||||||
| Number of Accounts | mil | ... | ... | ... | ... | ... | ... | ... | ... | ... | ... | ... | ... | ... | ... | ... | ... | ||||||||
| Number of Primary Customers | mil | ... | ... | ... | ... | ... | ... | ... | ... | ... | ... | ... | ... | ... | ... | ||||||||||
| Number of Mortgages | mil | ... | ... | ... | ... | ... | ... | ... | ... | ... | ... | ... | ... | ... | ... | ||||||||||
| Average Size of Deposit | CZK | ... | ... | ... | ... | ... | ... | ... | ... | ... | ... | ... | ... | ... | ... | ... | ... | ||||||||
| Average Size of Mortgage Loan | CZK | ... | ... | ... | ... | ... | ... | ... | ... | ... | ... | ... | ... | ... | ... | ||||||||||
| Accounts (As % of Total Clients) | % | ... | ... | ... | ... | ... | ... | ... | ... | ... | ... | ... | ... | ... | ... | ... | ... | ||||||||
| Primary (As % of Total Clients) | % | ... | ... | ... | ... | ... | ... | ... | ... | ... | ... | ... | ... | ... | ... | ||||||||||
| Mortgages (As % of Total Clients) | % | ... | ... | ... | ... | ... | ... | ... | ... | ... | ... | ... | ... | ... | ... | ||||||||||
| Revenue per Customer (Local Currency) | CZK | 2,053 | 1,951 | 2,116 | 1,786 | 1,300 | |||||||||||||||||||
| Net Profit per Customer (Local Currency) | CZK | 768 | 660 | 735 | 380 | 530 | |||||||||||||||||||
| Loan per Customer (Local Currency) | CZK | 84,878 | 88,694 | 91,738 | 97,061 | 95,978 | |||||||||||||||||||
| Deposit per Customer (Local Currency) | CZK | 102,202 | 104,236 | 105,962 | 108,524 | 110,538 | |||||||||||||||||||
| Revenue per Customer | USD | 87.5 | 89.2 | 93.8 | 81.2 | 60.0 | |||||||||||||||||||
| Net Profit per Customer | USD | 32.7 | 30.2 | 32.6 | 17.3 | 24.5 | |||||||||||||||||||
| Loan per Customer | USD | 3,987 | 3,948 | 4,055 | 4,538 | 4,372 | |||||||||||||||||||
| Deposit per Customer | USD | 4,800 | 4,640 | 4,684 | 5,074 | 5,036 |
Get all company financials in excel:


By Helgi Library - May 12, 2024
CSOB Stavebni Sporitelna employed 184 persons in 2023-12-31, up 1.10% when compared to the previous year. Historically, the bank's workforce hit an all time high of 580 persons in 2015-03-31 and an all time low of 180 in 2023-03-31. Average cost reached USD 5,110 ...
By Helgi Library - May 12, 2024
CSOB Stavebni Sporitelna made a net profit of CZK 151 mil in the fourth quarter of 2023, down 66.2% when compared to the same period of last year. This implies a return on equity of 6.48%. Historically, the bank’s net profit reached an all time high of CZK 641 mi...
By Helgi Library - May 12, 2024
CSOB Stavebni Sporitelna made a net profit of CZK 151 mil under revenues of CZK 436 mil in the fourth quarter of 2023, down 66.2% and 45.7% respectively when compared to the same period last year. Historically, the bank’s net profit reached an all time high of ...
By Helgi Library - May 12, 2024
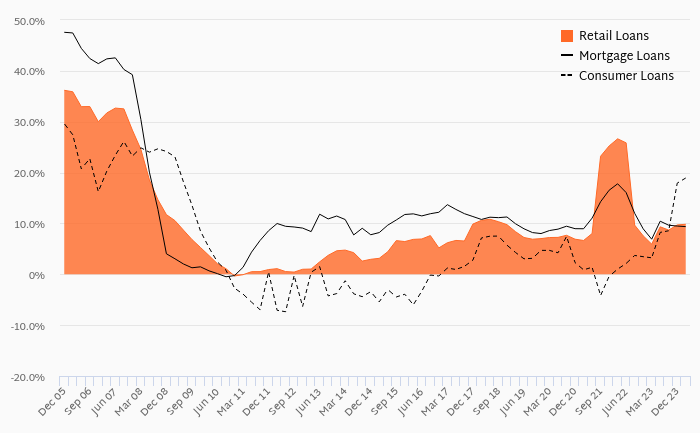
CSOB Stavebni Sporitelna's mortgage loans reached CZK 122,379 mil in 4Q2023, up 0.186% compared to the previous year. Czech banking sector provided mortgage loans of CZK 1,742 bil in 4Q2023, up 0.752% when compared to the last year. CSOB Stavebni Sporitel...
By Helgi Library - May 12, 2024
CSOB Stavebni Sporitelna's non-performing loans reached 1.61% of total loans at the end of 2023-12-31, up from 1.55% compared to the previous year. Historically, the NPL ratio hit an all time high of 4.72% in 2018-06-30 and an all time low of 0.538% in 2003-09-30...
By Helgi Library - May 12, 2024
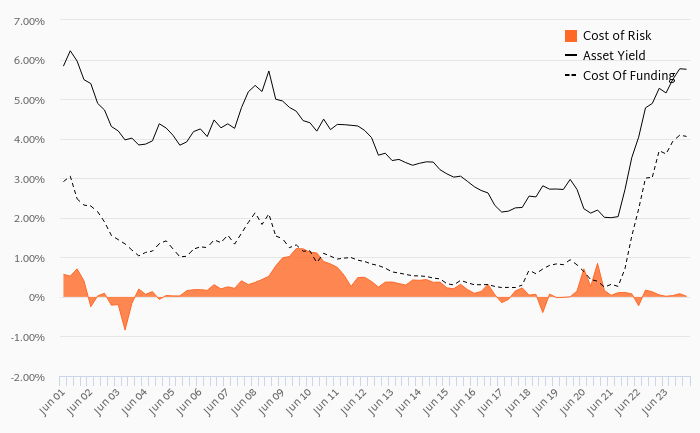
CSOB Stavebni Sporitelna's net interest margin amounted to 1.59% in the fourth quarter of 2023, down from 1.68% when compared to the previous quarter. Historically, the bank’s net interest margin reached an all time high of 2.28% in 4Q2009 and an all time lo...
By Helgi Library - May 12, 2024
CSOB Stavebni Sporitelna's customer deposits reached CZK 122,698 mil in 2023-12-31, down 0.425% compared to the previous year. Czech banking sector accepted customer deposits of CZK 6,701 bil in 2023-12-31, down 3.35% when compared to the last year. CSOB ...
By Helgi Library - May 12, 2024
CSOB Stavebni Sporitelna's customer loans reached CZK 122,166 mil in 2023-09-30, down 0.659% compared to the previous year. Czech banking sector provided customer loans of CZK 4,290 bil in 2023-09-30, up 1.99% when compared to the last year. CSOB Stavebni...
By Helgi Library - May 12, 2024
CSOB Stavebni Sporitelna's retail deposits reached CZK 122,698 mil in 2023-12-31, up 5.35% compared to the previous year. Czech banking sector accepted retail deposits of CZK 3,651 bil in 2023-12-31, up 2.05% when compared to the last year. CSOB Stavebni ...
By Helgi Library - May 12, 2024
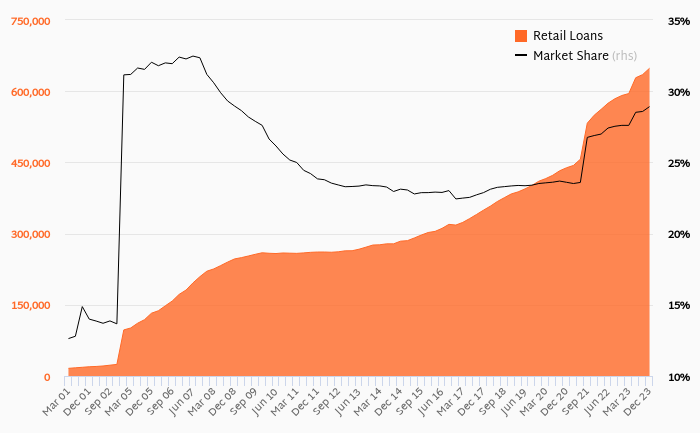
CSOB Stavebni Sporitelna's retail loans reached CZK 122,379 mil in the fourth quarter of 2023, up 0.186% compared to the previous year. Czech banking sector provided retail loans of CZK 2,242 bil in 4Q2023, up 0.906% when compared to the last year. CSOB S...
ČSOB Stavební Spořitelna is the biggest building society in the Czech Republic. It was founded in 1993 as a joint venture between ČSOB and Bausparkasse Schwäbisch Hall. Since its beginning, ČMSS has concluded more than 8 mil building savings contracts and provided its clients with more than 1.1 mil housing loans. In April 2019, ČSOB became its sole shareholder. Formerly known as ČMSS, also known in Czech Republic as “the Fox” because of its mascot, is the biggest building savings bank in the Czech Republic with approximately 40% market share in building savings loans and building savings deposits. ČMSS currently has around 1.3 mil clients, some 1,800 tied agents and approximately 300 advisory points.

CSOB Stavebni Sporitelna has been growing its revenues and asset by -2.95% and -2.03% a year on average in the last 10 years. Its loans and deposits have grown by 0.035% and -2.24% a year during that time and loans to deposits ratio reached 98.7% at the end of 2023. The company achieved an average return on equity of 10.9% in the last decade with net profit growing -3.38% a year on average. In terms of operating efficiency, its cost to income ratio reached 51.2% in 2023, compared to 50.4% average in the last decade.
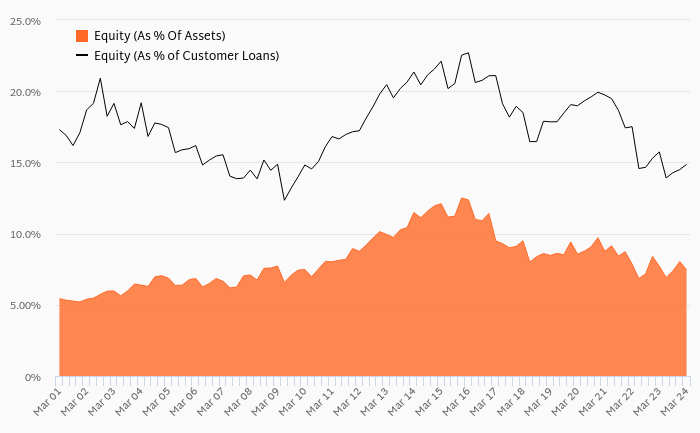
Equity represented 7.34% of total assets or 8.17% of loans at the end of 2023. CSOB Stavebni Sporitelna's non-performing loans were 1.61% of total loans while provisions covered some 80.8% of NPLs at the end of 2023.
 Helgi Library