By Helgi Library - September 27, 2020
Isuzu Motors generated sales of JPY 327 bil in 2Q2020, down 35.7% compared to the previous year. Historically, between ...
By Helgi Library - October 12, 2020
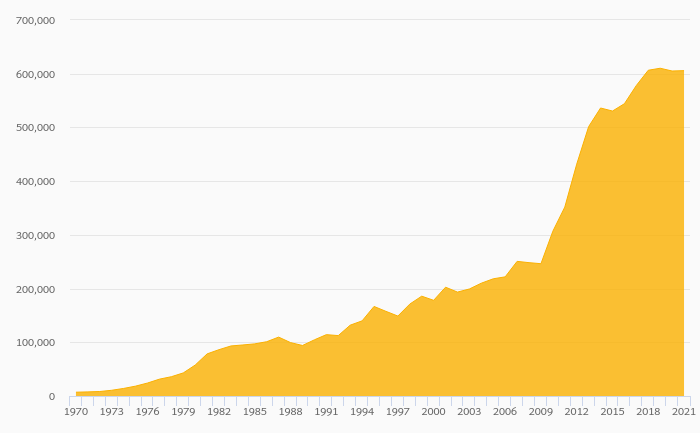
Isuzu Motors's total assets reached JPY 2,050 bil at the end of 2Q2020, down 4.7% compared to the previous year. C...
By Helgi Library - September 27, 2020
Isuzu Motors made a net profit of JPY 13.8 bil with revenues of JPY 562 bil in 1Q2020, down by 29.1% and up by 0.153%, ...
| Profit Statement |
| Balance Sheet |
| Ratios |
| Valuation |
Get all company financials in excel:
Get all company financials in excel:


By Helgi Library - September 27, 2020
Isuzu Motors's operating cash flow stood at JPY 19.8 bil in 1Q2020, down 23.1% when compared to the previous year. Historically, between 2Q1999 - 1Q2020, the firm’s operating cash flow reached a high of JPY 68.0 bil in 2Q2010 and a low of JPY -31.7 bil...
By Helgi Library - September 27, 2020
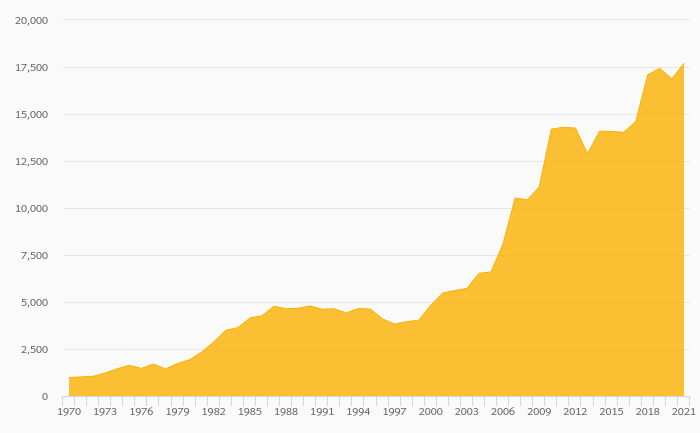
Isuzu Motors employed 36,856 employees in 2019, down 1.09% compared to the previous year. Historically, between 1999 and 2019, the firm's workforce hit a high of 37,263 employees in 2018 and a low of 18,130 employees in 2003. Average personnel cost s...
By Helgi Library - September 27, 2020
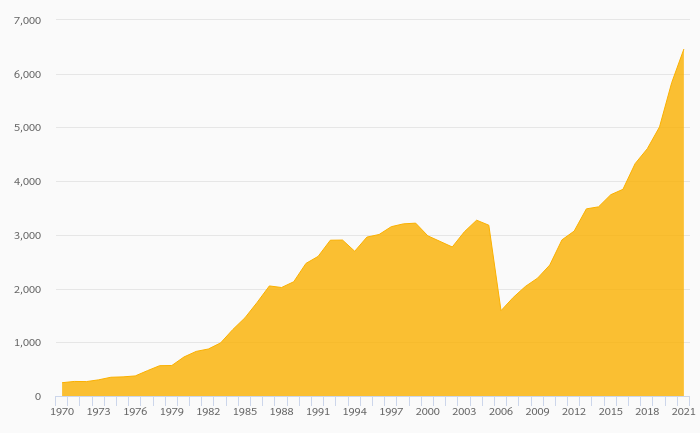
Isuzu Motors made a net profit of JPY 86.9 bil with revenues of JPY 2,079 bil in 2019, down by 25% and down by 3.7%, respectively, compared to the previous year. This translates into a net margin of 4.18%. On the operating level, EBITDA reached JPY 224 bi...
By Helgi Library - September 27, 2020
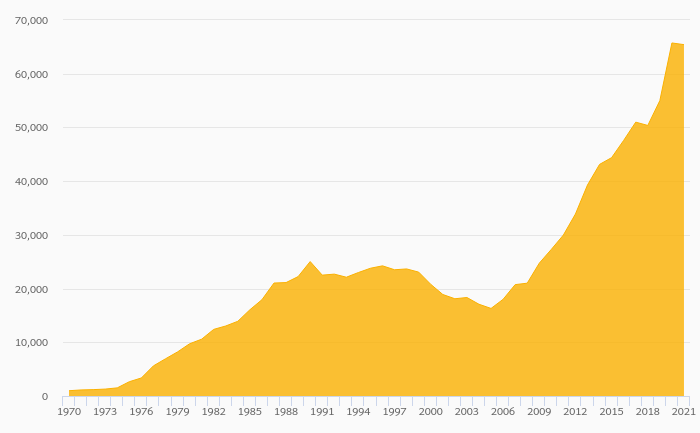
Isuzu Motors stock traded at JPY 1,396 per share at the end 2019 translating into a market capitalization of USD 9,665 mil. Since the end of 2014, stock has appreciated by 37.2% representing an annual average growth of 6.53%. In absolute terms, the valu...
By Helgi Library - September 27, 2020
Isuzu Motors stock traded at JPY 1,396 per share at the end 2019 implying a market capitalization of USD 9,665 mil. Since the end of 2014, stock has appreciated by 37.2% implying an annual average growth of 6.53% In absolute terms, the value of the company ...
By Helgi Library - September 27, 2020
Isuzu Motors's total assets reached JPY 2,130 bil at the end of 2019, up 4.5% compared to the previous year. Current assets amounted to JPY 1,097 bil, or 51.5% of total assets while cash stood at JPY 278 bil at the end of 2019. ...
By Helgi Library - September 27, 2020
Isuzu Motors's net debt stood at JPY 43.4 bil and accounted for 3.80% of equity at the end of 2019. The ratio is up 3.92 pp compared to the previous year. Historically, the firm’s net debt to equity reached a high of 1,595% in 2002 and a low of ...
By Helgi Library - September 27, 2020
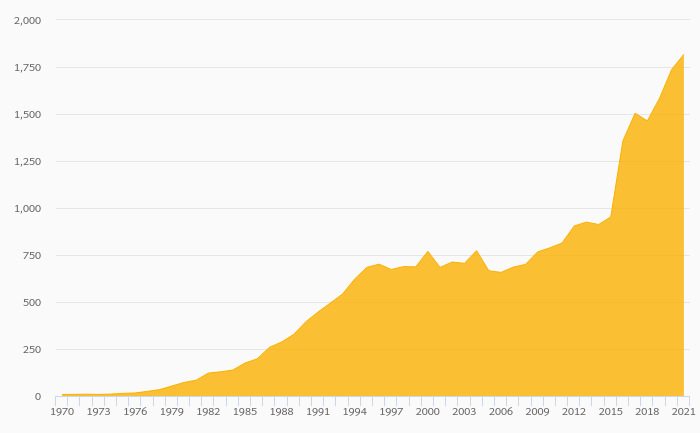
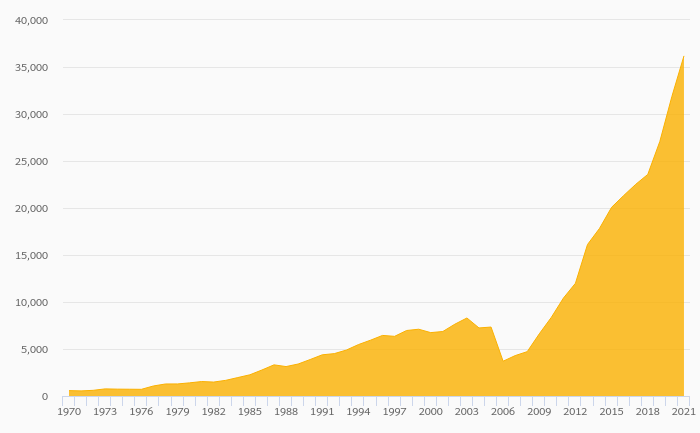
Isuzu Motors made a net profit of JPY 86.9 bil in 2019, down 25% compared to the previous year. Historically, between 1992 and 2019, the company's net profit reached a high of JPY 121 bil in 2013 and a low of JPY -124 bil in 2002. The result implies a ret...
By Helgi Library - September 27, 2020
Isuzu Motors's operating cash flow stood at JPY 130 bil in 2019, down 26.3% when compared to the previous year. Historically, between 2000 - 2019, the firm’s operating cash flow reached a high of JPY 177 bil in 2017 and a low of JPY 30.8 bil in 200...
By Helgi Library - September 27, 2020
Isuzu Motors made a net profit of JPY 86.9 bil with revenues of JPY 2,079 bil in 2019, down by 25.0% and down by 3.70%, respectively, compared to the previous year. This translates into a net margin of 4.18%. Historically, between 1992 and 2019, the...
Isuzu Motors Ltd. is a Japanese commercial vehicles and diesel engine manufacturing company headquartered in Tokyo, Japan. Its principal activity is the production, distribution and sale of Isuzu commercial vehicles and diesel engines. The company was founded by Yoshisuke Aikawa in 1916, as the Tokyo Gas Company, a Japanese oil and gasoline manufacturer, which in 1934 fused with the carmaker and was renamed Isuzu, after Isuzu River. Isuzu is famous for producing commercial vehicles and diesel engines. Isuzu-branded vehicles are sold in most commercial markets worldwide. Isuzu diesel engines are used by Renault-Nissan Alliance and General Motors. It operates a 50:50 joint venture with Anadolu Group called Anadolu Isuzu, which was formed in 1984 and is developing a range of minibus, city bus and intercity bus for sale Turkey

Isuzu Motors has been growing its sales by 2.72% a year on average in the last 5 years. EBITDA has grown on average by 1.03% a year during that time to total of JPY 224 bil in 2019, or 10.8% of sales. That’s compared to 11.4% average margin seen in last five years.
The company netted JPY 86.9 bil in 2019 implying ROE of 7.81% and ROCE of 6.36%. Again, the average figures were 10.7% and 9.04%, respectively when looking at the previous 5 years.
Isuzu Motors’s net debt amounted to JPY 43.4 bil at the end of 2019, or 3.80% of equity. When compared to EBITDA, net debt was 0.194x, up when compared to average of -0.033x seen in the last 5 years.
Isuzu Motors stock traded at JPY 1,396 per share at the end of 2019 resulting in a market capitalization of USD 9,665 mil. Over the previous five years, stock price grew by 37.2% or 6.53% a year on average. The closing price put stock at a 12-month trailing EV/EBITDA of 4.75x and price to earnings (PE) of 9.30x as of 2019.
 Helgi Library