By Helgi Library - April 2, 2020
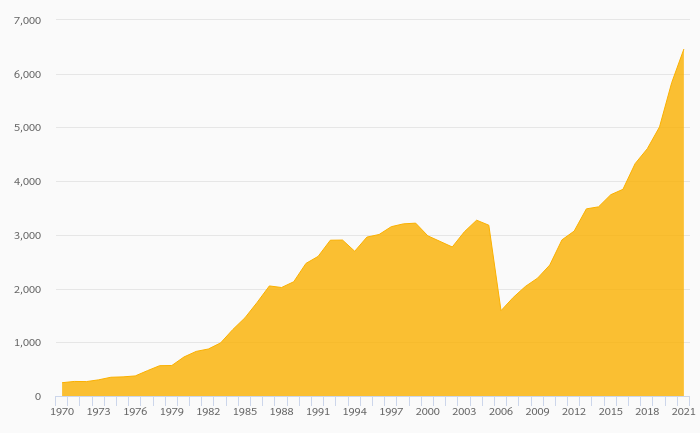
KTM's total assets reached EUR 1,092 mil at the end of 2017, up 3.35% compared to the previous year. Current asset...
| Profit Statement |
| Balance Sheet |
| Ratios |
| Valuation |
Get all company financials in excel:
Get all company financials in excel:


KTM AG is an Austria-based holding company producing motorcycles. The Company develops and manufactures vehicles and motorcycles under KTM and HUSABREG brands. KTM-Sportmotorcycle AG based in Mattighofen is the operative company of the Group and manufactures and develops race-ready offroad and street motorcycles. KTM products are distributed globally via 23 sales companies and two joint ventures in Dubai and New Zealand to more than 1,100 independent dealers and importers. In 2007 KTM entered a partnership with the Indian Bajaj Group, the second biggest motorcycles and three wheeler manufacturer in India
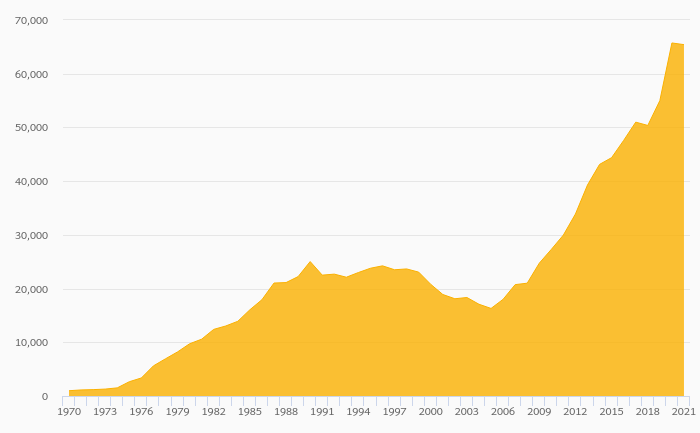
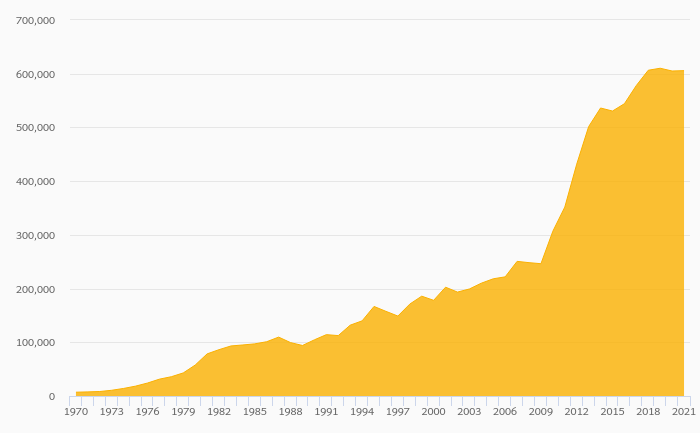
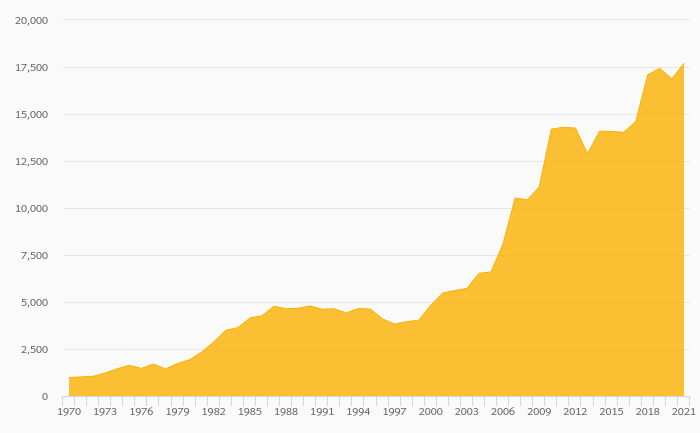
KTM has been growing its sales by a year on average in the last 5 years. EBITDA has grown on average by 21.3% a year during that time to total of EUR 179 mil in 2017, or 13.4% of sales. That’s compared to 13.3% average margin seen in last five years.
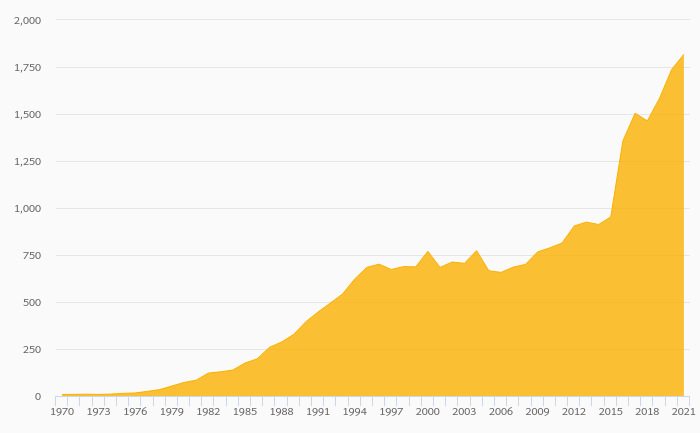
The company netted EUR 78.8 mil in 2017 implying ROE of 17.2% and ROCE of 12.1%. Again, the average figures were 17.1% and 11.5%, respectively when looking at the previous 5 years.
KTM’s net debt amounted to EUR 73.0 mil at the end of 2017, or 15.0% of equity. When compared to EBITDA, net debt was 0.408x, down when compared to average of 0.670x seen in the last 5 years.
KTM stock traded at EUR 67.4 per share at the end of 2017 resulting in a market capitalization of USD 876 mil. Over the previous five years, stock price grew by 43.4% or 7.48% a year on average. The closing price put stock at a 12-month trailing EV/EBITDA of 4.80x and price to earnings (PE) of 9.27x as of 2017.
 Helgi Library