By Helgi Library - May 21, 2023
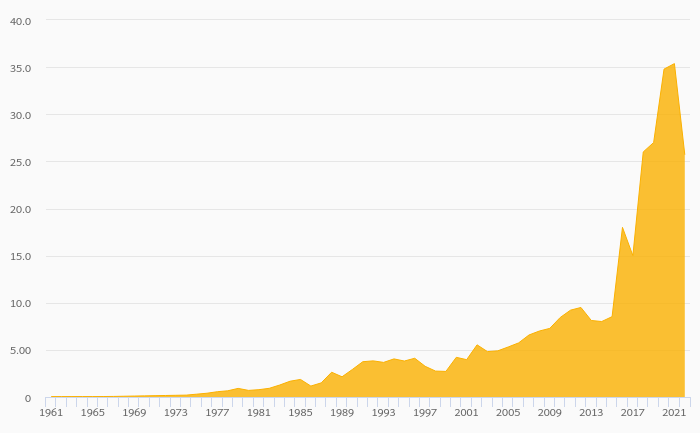
Notino made a net profit of CZK 519 mil with revenues of CZK 18,426 mil in 2021, up by 3.85% and up by 19.8%, respe...
By Helgi Library - May 21, 2023
Notino employed 1,417 employees in 2021, up 19.3% compared to the previous year. Historically, between 2013 and 2021, ...
By Helgi Library - May 21, 2023
Notino's net debt stood at CZK 4,327 mil and accounted for 158% of equity at the end of 2021. The ratio is up 72.1 pp ...
| Profit Statement | 2019 | 2020 | 2021 | |
| Sales | CZK mil | 10,436 | 15,381 | 18,426 |
| Gross Profit | CZK mil | 1,119 | 1,589 | 1,883 |
| EBITDA | CZK mil | 426 | 662 | 733 |
| EBIT | CZK mil | 350 | 596 | 613 |
| Financing Cost | CZK mil | 14.1 | 24.2 | 39.0 |
| Pre-Tax Profit | CZK mil | 285 | 624 | 659 |
| Net Profit | CZK mil | 227 | 500 | 519 |
| Dividends | CZK mil | 0 | 0 | ... |
| Balance Sheet | 2019 | 2020 | 2021 | |
| Total Assets | CZK mil | 3,383 | 5,797 | 9,118 |
| Non-Current Assets | CZK mil | 271 | 358 | 631 |
| Current Assets | CZK mil | 3,077 | 5,407 | 8,383 |
| Working Capital | CZK mil | 2,222 | 4,224 | 6,814 |
| Shareholders' Equity | CZK mil | 1,726 | 2,226 | 2,745 |
| Liabilities | CZK mil | 1,657 | 3,571 | 6,373 |
| Total Debt | CZK mil | 709 | 2,117 | 4,427 |
| Net Debt | CZK mil | 495 | 1,903 | 4,327 |
| Ratios | 2019 | 2020 | 2021 | |
| ROE | % | 14.4 | 25.3 | 20.9 |
| ROCE | % | 9.86 | 14.1 | 8.63 |
| Gross Margin | % | 10.7 | 10.3 | 10.2 |
| EBITDA Margin | % | 4.09 | 4.30 | 3.98 |
| EBIT Margin | % | 3.35 | 3.87 | 3.33 |
| Net Margin | % | 2.17 | 3.25 | 2.82 |
| Net Debt/EBITDA | 1.16 | 2.88 | 5.90 | |
| Net Debt/Equity | % | 28.7 | 85.5 | 158 |
| Cost of Financing | % | 2.19 | 1.71 | 1.19 |
| Cash Flow | 2019 | 2020 | 2021 | |
| Total Cash From Operations | CZK mil | 357 | -928 | -1,857 |
| Total Cash From Investing | CZK mil | -152 | -144 | -404 |
| Total Cash From Financing | CZK mil | -87.7 | 1,071 | 2,148 |
| Net Change In Cash | CZK mil | 117 | -0.795 | -113 |
| Cash Conversion Cycle | days | 84.9 | 109 | 147 |
| Cash Earnings | CZK mil | 304 | 566 | 639 |
| Free Cash Flow | CZK mil | 205 | -1,071 | -2,261 |
Get all company financials in excel:
| overview | Unit | 2012 | 2013 | 2014 | 2015 | 2016 | 2017 | 2018 | 2019 | 2020 | 2021 |
| income statement | |||||||||||
| Sales | CZK mil | 5,339 | 5,550 | 7,396 | 8,590 | 10,436 | |||||
| Gross Profit | CZK mil | 428 | 352 | 587 | 887 | 1,119 | |||||
| EBIT | CZK mil | 228 | 115 | 131 | 308 | 350 | |||||
| Net Profit | CZK mil | 77.4 | 86.0 | 114 | 209 | 227 | |||||
| ROE | % | 73.2 | 23.1 | 16.1 | 18.7 | 14.4 | |||||
| EBIT Margin | % | 4.27 | 2.08 | 1.77 | 3.59 | 3.35 | |||||
| Net Margin | % | 1.45 | 1.55 | 1.54 | 2.44 | 2.17 | |||||
| Employees | ... | 325 | 538 | 727 | 843 | 1,188 | |||||
| balance sheet | |||||||||||
| Total Assets | CZK mil | 1,744 | 1,961 | 2,151 | 2,773 | 3,383 | |||||
| Non-Current Assets | CZK mil | 52.8 | 105 | 155 | 182 | 271 | |||||
| Current Assets | CZK mil | 1,681 | 1,846 | 1,946 | 2,548 | 3,077 | |||||
| Shareholders' Equity | CZK mil | 144 | 601 | 815 | 1,424 | 1,726 | |||||
| Liabilities | CZK mil | 1,600 | 1,360 | 1,336 | 1,349 | 1,657 | |||||
| Non-Current Liabilities | CZK mil | 25.4 | 20.3 | 10.2 | 6.80 | 17.6 | |||||
| Current Liabilities | CZK mil | 1,573 | 1,331 | 1,299 | 1,300 | 1,560 | |||||
| Net Debt/EBITDA | 0.931 | 1.53 | 0.846 | 1.41 | 1.16 | ||||||
| Net Debt/Equity | % | 157 | 31.1 | 18.3 | 33.9 | 28.7 | |||||
| Cost of Financing | % | ... | 1.28 | 0.440 | 0.609 | 2.17 | 2.19 | ||||
| cash flow | |||||||||||
| Total Cash From Operations | CZK mil | ... | -158 | -248 | 27.4 | -594 | 357 | ||||
| Total Cash From Investing | CZK mil | ... | -16.5 | -80.3 | -81.5 | -50.3 | -152 | ||||
| Total Cash From Financing | CZK mil | ... | 184 | 353 | 113 | 601 | -87.7 | ||||
| Net Change In Cash | CZK mil | ... | 9.37 | 24.9 | 58.4 | -42.4 | 117 |
| income statement | Unit | 2012 | 2013 | 2014 | 2015 | 2016 | 2017 | 2018 | 2019 | 2020 | 2021 |
| income statement | |||||||||||
| Sales | CZK mil | 5,339 | 5,550 | 7,396 | 8,590 | 10,436 | |||||
| Cost of Goods & Services | CZK mil | 4,911 | 5,198 | 6,809 | 7,703 | 9,316 | |||||
| Gross Profit | CZK mil | 428 | 352 | 587 | 887 | 1,119 | |||||
| Staff Cost | CZK mil | 175 | 230 | 407 | 545 | 676 | |||||
| Other Operating Cost (Income) | CZK mil | 9.47 | -0.180 | 3.43 | -1.37 | 16.9 | |||||
| EBITDA | CZK mil | 244 | 122 | 176 | 343 | 426 | |||||
| Depreciation | CZK mil | 15.6 | 6.97 | 45.2 | 34.8 | 76.8 | |||||
| EBIT | CZK mil | 228 | 115 | 131 | 308 | 350 | |||||
| Net Financing Cost | CZK mil | 129 | 9.97 | -13.5 | 44.7 | 64.9 | |||||
| Financing Cost | CZK mil | 2.45 | 1.21 | 1.70 | 9.41 | 14.1 | |||||
| Financing Income | CZK mil | 0.776 | 1.55 | 5.18 | 2.27 | 0.203 | |||||
| Extraordinary Cost | CZK mil | 0 | 0 | 0 | 0 | 0 | |||||
| Pre-Tax Profit | CZK mil | 98.6 | 105 | 144 | 264 | 285 | |||||
| Tax | CZK mil | 21.2 | 19.2 | 30.2 | 54.2 | 57.8 | |||||
| Net Profit | CZK mil | 77.4 | 86.0 | 114 | 209 | 227 | |||||
| Net Profit Avail. to Common | CZK mil | 77.4 | 86.0 | 114 | 209 | 227 | |||||
| Dividends | CZK mil | ... | ... | 0 | 0 | 0 | 0 | 0 | ... | ||
| growth rates | |||||||||||
| Total Revenue Growth | % | ... | 34.3 | 3.95 | 33.3 | 16.1 | 21.5 | ||||
| Staff Cost Growth | % | ... | 45.7 | 31.4 | 76.8 | 33.8 | 24.0 | ||||
| EBITDA Growth | % | ... | 25.4 | -49.8 | 44.1 | 94.8 | 24.3 | ||||
| EBIT Growth | % | ... | 24.9 | -49.4 | 13.5 | 136 | 13.4 | ||||
| Pre-Tax Profit Growth | % | ... | 97.8 | 6.78 | 37.1 | 82.6 | 8.03 | ||||
| Net Profit Growth | % | ... | 92.2 | 11.2 | 32.6 | 83.5 | 8.38 | ||||
| ratios | |||||||||||
| ROE | % | 73.2 | 23.1 | 16.1 | 18.7 | 14.4 | |||||
| ROA | % | 5.39 | 4.64 | 5.55 | 8.50 | 7.37 | |||||
| ROCE | % | ... | 18.3 | 11.1 | 11.0 | 13.0 | 9.86 | ||||
| Gross Margin | % | 8.02 | 6.35 | 7.94 | 10.3 | 10.7 | |||||
| EBITDA Margin | % | 4.56 | 2.20 | 2.38 | 3.99 | 4.09 | |||||
| EBIT Margin | % | 4.27 | 2.08 | 1.77 | 3.59 | 3.35 | |||||
| Net Margin | % | 1.45 | 1.55 | 1.54 | 2.44 | 2.17 | |||||
| Payout Ratio | % | ... | ... | 0 | 0 | 0 | 0 | 0 | ... | ||
| Cost of Financing | % | ... | 1.28 | 0.440 | 0.609 | 2.17 | 2.19 | ||||
| Net Debt/EBITDA | 0.931 | 1.53 | 0.846 | 1.41 | 1.16 |
| balance sheet | Unit | 2012 | 2013 | 2014 | 2015 | 2016 | 2017 | 2018 | 2019 | 2020 | 2021 |
| balance sheet | |||||||||||
| Cash & Cash Equivalents | CZK mil | 56.1 | 81.1 | 139 | 97.1 | 214 | |||||
| Receivables | CZK mil | 227 | 395 | 303 | 403 | 504 | |||||
| Inventories | CZK mil | 1,397 | 1,370 | 1,503 | 2,047 | 2,358 | |||||
| Other ST Assets | CZK mil | 0.901 | 0 | 0 | < -0.001 | 0 | |||||
| Current Assets | CZK mil | 1,681 | 1,846 | 1,946 | 2,548 | 3,077 | |||||
| Property, Plant & Equipment | CZK mil | 48.8 | 99.0 | 151 | 180 | 271 | |||||
| LT Investments & Receivables | CZK mil | < -0.001 | < -0.001 | < -0.001 | < -0.001 | < 0.001 | |||||
| Intangible Assets | CZK mil | 3.92 | 6.05 | 4.37 | 1.48 | 0.560 | |||||
| Goodwill | CZK mil | 0 | 0 | 0 | 0 | 0 | |||||
| Non-Current Assets | CZK mil | 52.8 | 105 | 155 | 182 | 271 | |||||
| Total Assets | CZK mil | 1,744 | 1,961 | 2,151 | 2,773 | 3,383 | |||||
| Trade Payables | CZK mil | 1,086 | 915 | 849 | 525 | 640 | |||||
| Short-Term Debt | CZK mil | 283 | 261 | 283 | 573 | 692 | |||||
| Other ST Liabilities | CZK mil | 204 | 154 | 167 | 202 | 228 | |||||
| Current Liabilities | CZK mil | 1,573 | 1,331 | 1,299 | 1,300 | 1,560 | |||||
| Long-Term Debt | CZK mil | 0 | 7.00 | 5.18 | 6.80 | 17.6 | |||||
| Other LT Liabilities | CZK mil | 25.4 | 13.3 | 5.01 | 0 | 0 | |||||
| Non-Current Liabilities | CZK mil | 25.4 | 20.3 | 10.2 | 6.80 | 17.6 | |||||
| Liabilities | CZK mil | 1,600 | 1,360 | 1,336 | 1,349 | 1,657 | |||||
| Equity Before Minority Interest | CZK mil | 144 | 601 | 815 | 1,424 | 1,726 | |||||
| Minority Interest | CZK mil | 0 | 0 | 0 | 0 | 0 | |||||
| Equity | CZK mil | 144 | 601 | 815 | 1,424 | 1,726 | |||||
| growth rates | |||||||||||
| Total Asset Growth | % | ... | 55.2 | 12.4 | 9.71 | 28.9 | 22.0 | ||||
| Shareholders' Equity Growth | % | ... | 115 | 316 | 35.6 | 74.8 | 21.2 | ||||
| Net Debt Growth | % | ... | 332 | -17.5 | -20.4 | 224 | 2.58 | ||||
| Total Debt Growth | % | ... | 185 | -5.23 | 7.57 | 101 | 22.4 | ||||
| ratios | |||||||||||
| Total Debt | CZK mil | 283 | 268 | 288 | 579 | 709 | |||||
| Net Debt | CZK mil | 227 | 187 | 149 | 482 | 495 | |||||
| Working Capital | CZK mil | 538 | 850 | 957 | 1,926 | 2,222 | |||||
| Capital Employed | CZK mil | 590 | 955 | 1,112 | 2,108 | 2,493 | |||||
| Net Debt/Equity | % | 157 | 31.1 | 18.3 | 33.9 | 28.7 | |||||
| Current Ratio | 1.07 | 1.39 | 1.50 | 1.96 | 1.97 | ||||||
| Quick Ratio | 0.180 | 0.358 | 0.341 | 0.385 | 0.461 |
| cash flow | Unit | 2012 | 2013 | 2014 | 2015 | 2016 | 2017 | 2018 | 2019 | 2020 | 2021 |
| cash flow | |||||||||||
| Net Profit | CZK mil | 77.4 | 86.0 | 114 | 209 | 227 | |||||
| Depreciation | CZK mil | 15.6 | 6.97 | 45.2 | 34.8 | 76.8 | |||||
| Non-Cash Items | CZK mil | ... | 83.4 | -28.9 | -24.7 | 131 | 349 | ||||
| Change in Working Capital | CZK mil | ... | -334 | -312 | -107 | -969 | -296 | ||||
| Total Cash From Operations | CZK mil | ... | -158 | -248 | 27.4 | -594 | 357 | ||||
| Capital Expenditures | CZK mil | ... | -16.5 | -66.2 | -83.0 | -92.8 | -154 | ||||
| Other Investing Activities | CZK mil | ... | 0 | -14.1 | 1.45 | 42.5 | 2.40 | ||||
| Total Cash From Investing | CZK mil | ... | -16.5 | -80.3 | -81.5 | -50.3 | -152 | ||||
| Dividends Paid | CZK mil | ... | ... | ... | ... | 0 | 0 | 0 | 0 | ||
| Issuance Of Shares | CZK mil | ... | 0 | 370 | 100 | 400 | 75.0 | ||||
| Issuance Of Debt | CZK mil | ... | 184 | -17.5 | 12.6 | 201 | -163 | ||||
| Other Financing Activities | CZK mil | ... | 0 | 0 | 0 | 0 | 0 | ||||
| Total Cash From Financing | CZK mil | ... | 184 | 353 | 113 | 601 | -87.7 | ||||
| Net Change In Cash | CZK mil | ... | 9.37 | 24.9 | 58.4 | -42.4 | 117 | ||||
| ratios | |||||||||||
| Days Sales Outstanding | days | 15.5 | 26.0 | 14.9 | 17.1 | 17.6 | |||||
| Days Sales Of Inventory | days | 104 | 96.2 | 80.6 | 97.0 | 92.4 | |||||
| Days Payable Outstanding | days | 80.7 | 64.3 | 45.5 | 24.9 | 25.1 | |||||
| Cash Conversion Cycle | days | 38.6 | 57.9 | 50.0 | 89.3 | 84.9 | |||||
| Cash Earnings | CZK mil | 93.0 | 93.0 | 159 | 244 | 304 | |||||
| Free Cash Flow | CZK mil | ... | -174 | -328 | -54.1 | -644 | 205 | ||||
| Capital Expenditures (As % of Sales) | % | ... | 0.309 | 1.19 | 1.12 | 1.08 | 1.48 |
| other ratios | Unit | 2012 | 2013 | 2014 | 2015 | 2016 | 2017 | 2018 | 2019 | 2020 | 2021 |
| Employees | ... | 325 | 538 | 727 | 843 | 1,188 | |||||
| Cost Per Employee | USD per month | ... | 1,883 | 1,415 | 1,990 | 2,462 | 2,103 | ||||
| Cost Per Employee (Local Currency) | CZK per month | ... | 44,949 | 35,692 | 46,694 | 53,865 | 47,401 | ||||
| Material & Energy (As % of Sales) | % | 82.8 | 81.5 | 77.4 | 73.1 | 72.7 | |||||
| Services (As % of Sales) | % | 9.14 | 12.1 | 14.6 | 16.6 | 16.6 | |||||
| Staff Cost (As % of Sales) | % | 3.28 | 4.15 | 5.51 | 6.34 | 6.48 | |||||
| Effective Tax Rate | % | 21.5 | 18.3 | 20.9 | 20.6 | 20.3 | |||||
| Total Revenue Growth (5-year average) | % | ... | ... | ... | ... | ... | 27.9 | 24.8 | 21.3 |
Get all company financials in excel:
By Helgi Library - May 21, 2023
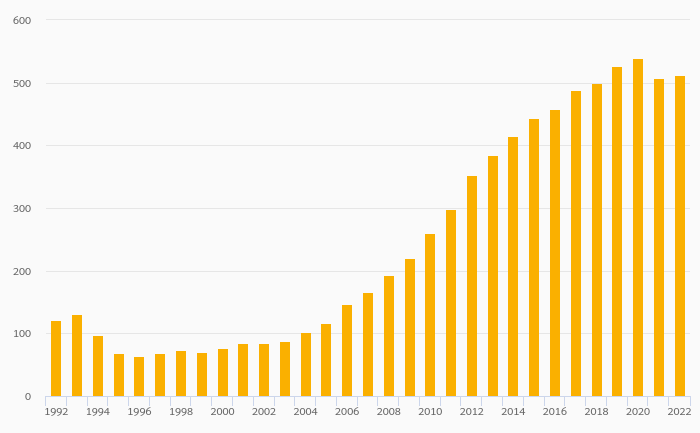
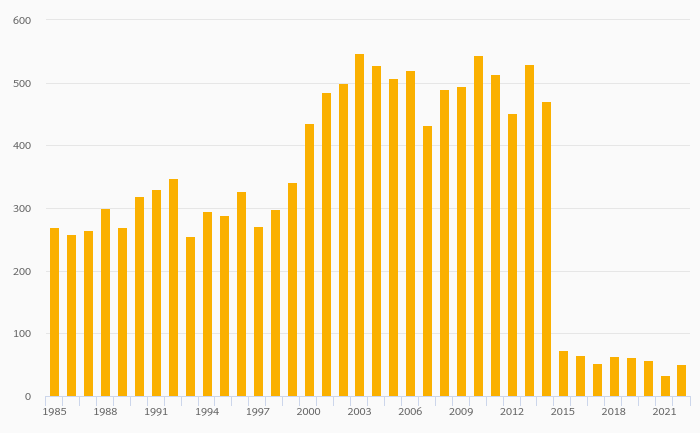
Notino invested a total of CZK 406 mil in 2021, up 135% compared to the previous year. Historically, between 2013 - 2021, the company's investments stood at a high of CZK 406 mil in 2021 and a low of CZK 16.5 mil in 2015. As a percent...
By Helgi Library - May 21, 2023
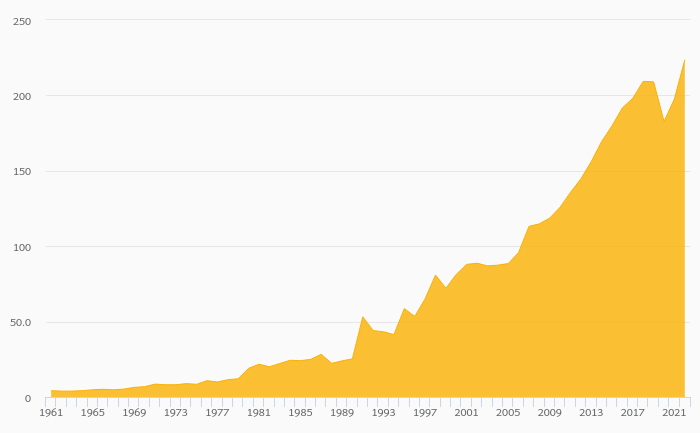
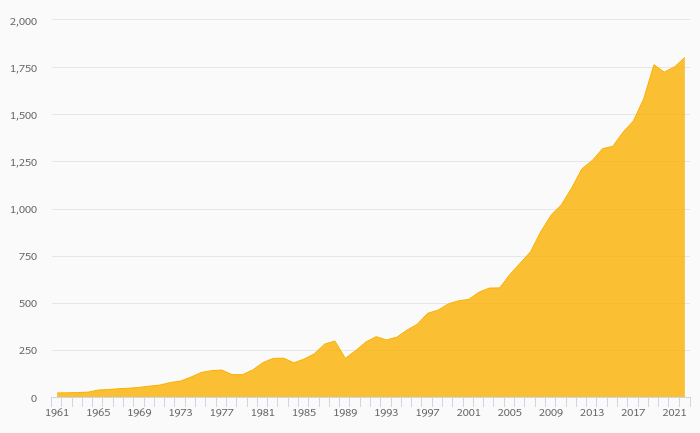
Notino made a net profit of CZK 519 mil with revenues of CZK 18,426 mil in 2021, up by 3.85% and up by 19.8%, respectively, compared to the previous year. This translates into a net margin of 2.82%. Historically, between 2012 and 2021, the firm’s ...
By Helgi Library - May 21, 2023
Notino made a net profit of CZK 519 mil in 2021, up 3.85% compared to the previous year. Historically, between 2012 and 2021, the company's net profit reached a high of CZK 519 mil in 2021 and a low of CZK 1.45 mil in 2012. The result implies a return on ...
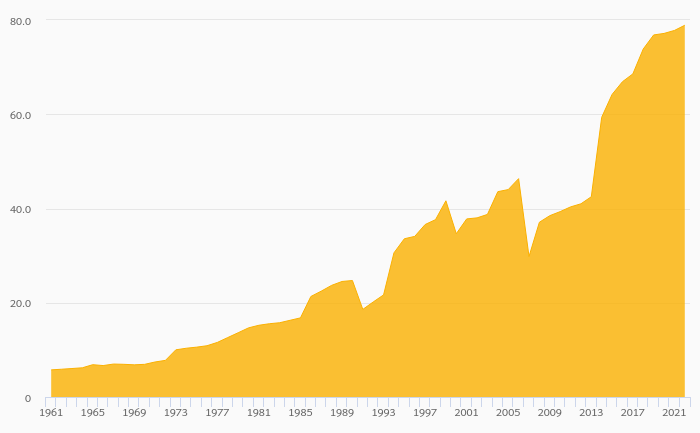
Notino has been growing its sales by 27.1% a year on average in the last 5 years. EBITDA has grown on average by 43.1% a year during that time to total of CZK 733 mil in 2021, or 3.98% of sales. That’s compared to 3.75% average margin seen in last five years.
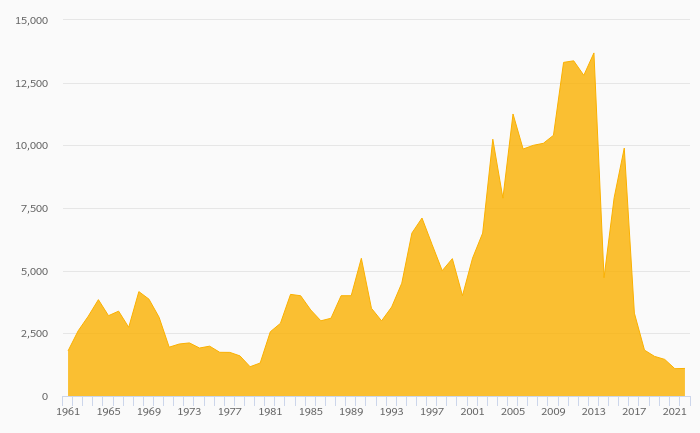
The company netted CZK 519 mil in 2021 implying ROE of 20.9% and ROCE of 8.63%. Again, the average figures were 19.1% and 11.3%, respectively when looking at the previous 5 years.
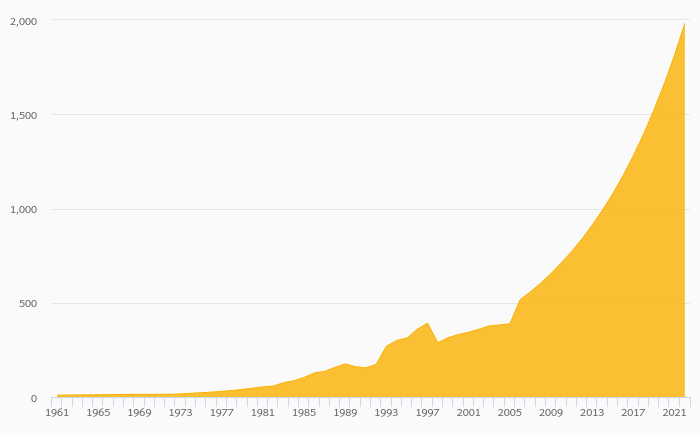
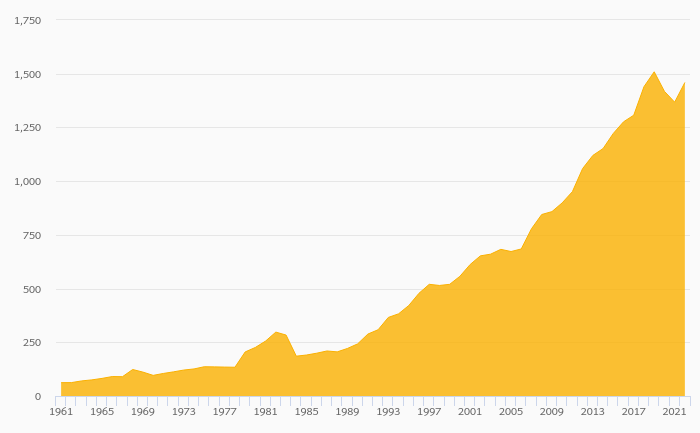
Notino’s net debt amounted to CZK 4,327 mil at the end of 2021, or 158% of equity. When compared to EBITDA, net debt was 5.90x, up when compared to average of 2.44x seen in the last 5 years.
 Helgi Library