By Helgi Library - August 16, 2020
PFNonwovens stock traded at CZK 700 per share at the end 4Q2019 translating into a market capitalization of USD 271 mil. Since th...
By Helgi Library - August 16, 2020
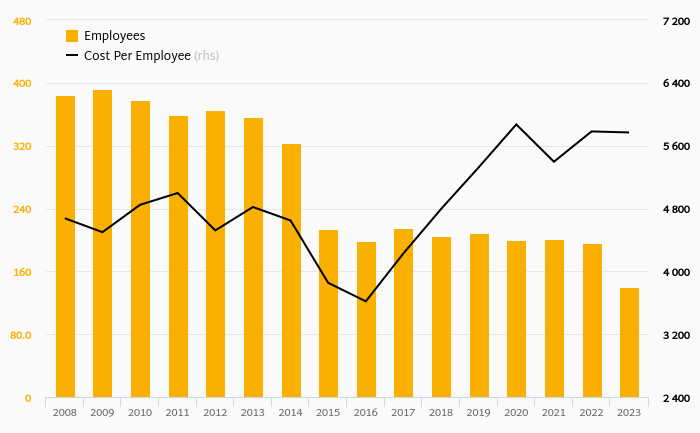
PFNonwovens employed 684 employees in 4Q2019, up 13.1% compared to the previous year. Historically, between 4Q2003 and ...
By Helgi Library - August 16, 2020
PFNonwovens made a net profit of EUR -0.607 mil with revenues of EUR 67.4 mil in 4Q2019, down by 106% and up by 4.65%, ...
| Profit Statement |
| Balance Sheet |
| Ratios |
| Valuation |
Get all company financials in excel:
Get all company financials in excel:


By Helgi Library - August 16, 2020
PFNonwovens generated sales of EUR 67.4 mil in 4Q2019, up 3.68% compared to the previous year. Historically, between 1Q2003 and 4Q2019, the company’s sales reached a high of EUR 67.4 mil in 4Q2019 and a low of EUR 16.6 mil in 1Q2003. Over the last...
By Helgi Library - August 16, 2020
PFNonwovens's net debt stood at EUR 191 mil and accounted for 88.4% of equity at the end of 4Q2019. The ratio is down 6.92 pp compared to the previous year. Historically, the firm’s net debt to equity reached a high of 987% in 2Q2006 and a low of...
By Helgi Library - August 16, 2020
PFNonwovens's operating cash flow stood at EUR 0.064 mil in 4Q2019, down 99.3% when compared to the previous year. Historically, between 1Q2003 - 4Q2019, the firm’s operating cash flow reached a high of EUR 24.4 mil in 1Q2019 and a low of EUR -12.1 mil...
By Helgi Library - August 16, 2020
PFNonwovens made a net profit of EUR -0.607 mil with revenues of EUR 67.4 mil in 4Q2019, down by 104% and up by 3.68%, respectively, compared to the previous year. This translates into a net margin of -0.900%. Historically, between 2003-03-31 and 4Q2019...
By Helgi Library - October 12, 2020
PFNonwovens's total assets reached EUR 456 mil at the end of 4Q2019, up 7.95% compared to the previous year. Current assets amounted to EUR 119 mil, or 26.2% of total assets while cash stood at EUR 7.97 mil at the end of 4Q2019. ...
By Helgi Library - August 16, 2020
PFNonwovens stock traded at CZK 700 per share at the end 4Q2019 translating into a market capitalization of USD 271 mil. Since the end of 4Q2014, the stock has appreciated by 10.5% representing an annual average growth of 2.02%. At the end of 4Q2019, the...
By Helgi Library - August 16, 2020
PFNonwovens invested a total of EUR 2.04 mil in 4Q2019, down 74.4% compared to the previous year. Historically, between 1Q2003 - 4Q2019, the company's investments stood at a high of EUR 33.3 mil in 3Q2019 and a low of EUR 0.068 mil in 1Q2009...
By Helgi Library - August 16, 2020
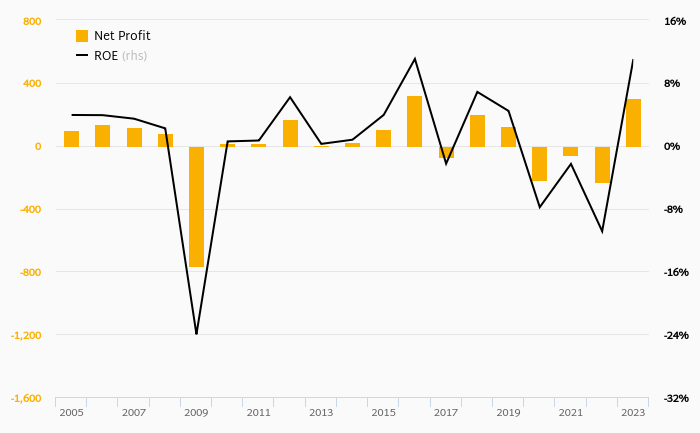
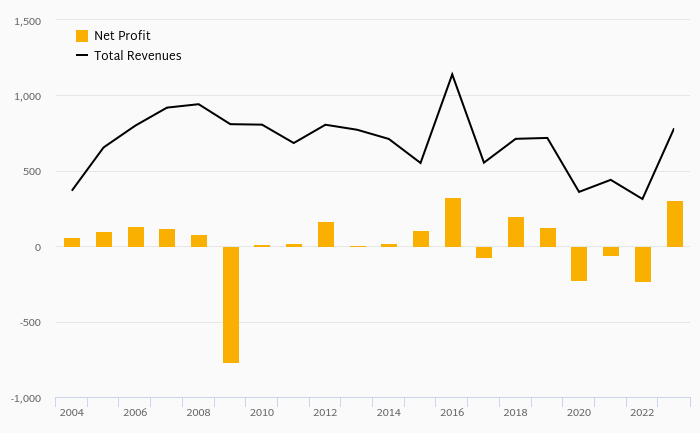
PFNonwovens made a net profit of EUR -0.607 mil in 4Q2019, down 104% compared to the previous year. Historically, between 1Q2003 and 4Q2019, the company's net profit reached a high of EUR 14.6 mil in 4Q2018 and a low of EUR -8.61 mil in 4Q2008. The result...
By Helgi Library - August 16, 2020
PFNonwovens stock traded at CZK 700 per share at the end 4Q2019 implying a market capitalization of USD 271 mil. Since the end of 4Q2014, stock has appreciated by 10.5% implying an annual average growth of 2.02% In absolute terms, the value of the company ...
By Helgi Library - August 16, 2020
PFNonwovens stock traded at CZK 700 per share at the end 2019 translating into a market capitalization of USD 271 mil. Since the end of 2014, stock has appreciated by 17.9% representing an annual average growth of 3.35%. In absolute terms, the value of ...
PFNonwovens is Europe’s second largest producers of nonwoven fabric for hygiene application. Based in Znojmo in the Czech Republic, the Company produced over 100,000 tonnes of fabric in 2014. Pegas’ top five customers represented a 78% share of total revenues. Its customer mix reflects the situation in the hygiene market, which is divided among a small number of end producers, each having a substantial market share; essentially all of its sales are in Western and Central Europe.

PFNonwovens has been growing its sales by 2.02% a year on average in the last 5 years. EBITDA has grown on average by 0.098% a year during that time to total of EUR 47.4 mil in 2019, or 18.6% of sales. That’s compared to 20.3% average margin seen in last five years.
The company netted EUR 18.4 mil in 2019 implying ROE of 9.02% and ROCE of 4.80%. Again, the average figures were 11.5% and 5.55%, respectively when looking at the previous 5 years.
PFNonwovens’s net debt amounted to EUR 191 mil at the end of 2019, or 88.4% of equity. When compared to EBITDA, net debt was 4.02x, up when compared to average of 3.81x seen in the last 5 years.
PFNonwovens stock traded at CZK 700 per share at the end of 2019 resulting in a market capitalization of USD 271 mil. Over the previous five years, stock price grew by 17.9% or 3.35% a year on average. The closing price put stock at a 12-month trailing EV/EBITDA of 9.02x and price to earnings (PE) of 333x as of 2019.
 Helgi Library