By Helgi Library - October 12, 2020
Skanska Group's total assets reached SEK 92,774 mil at the end of 4Q2014, up 5.75% compared to the previous year. ...
By Helgi Library - April 2, 2020
Skanska Group's total assets reached SEK 92,774 mil at the end of 2014, up 5.75% compared to the previous year. Cu...
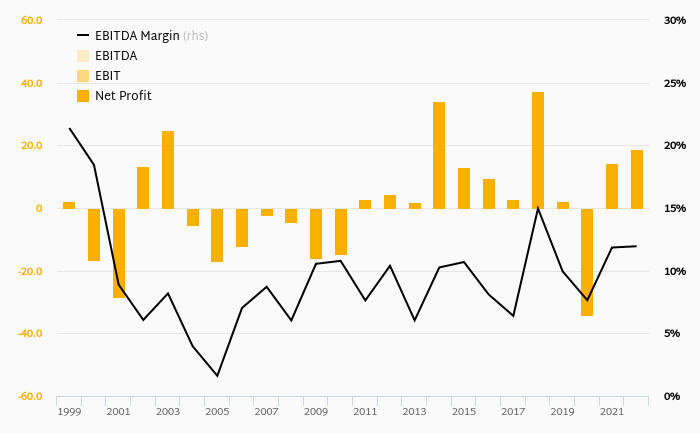
| Profit Statement |
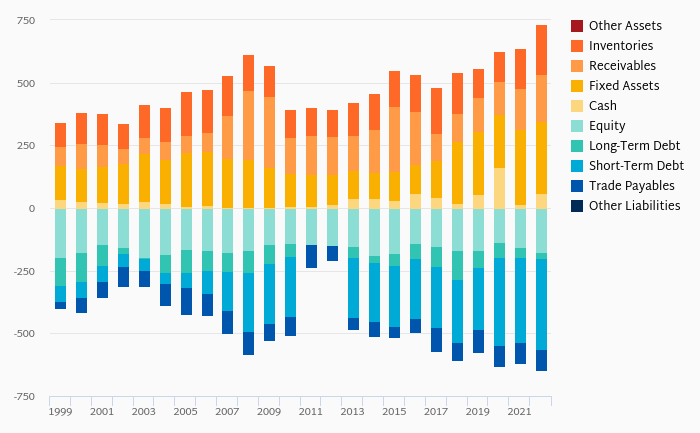
| Balance Sheet |
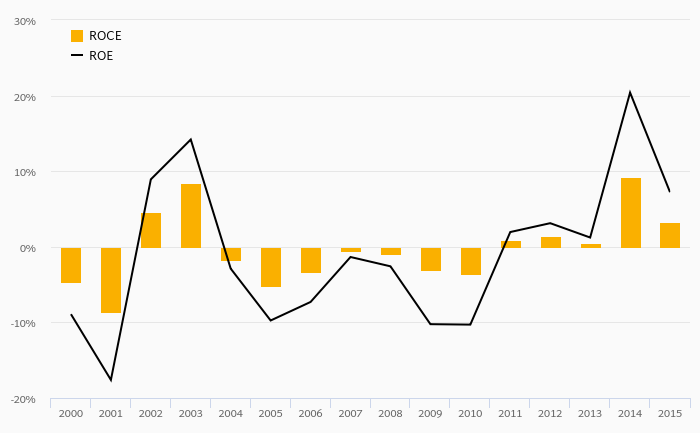
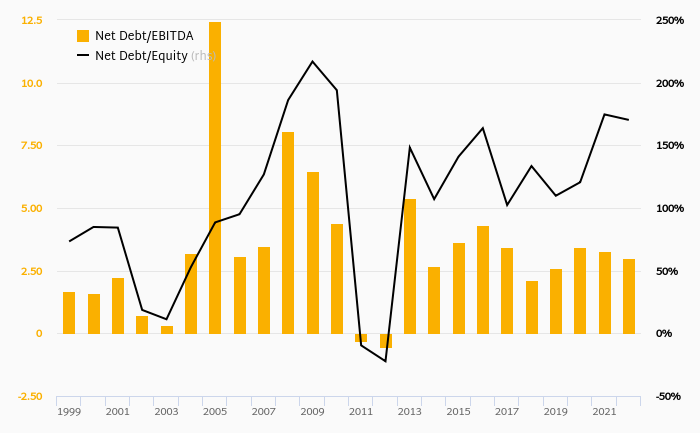
| Ratios |
| Valuation |
Get all company financials in excel:
Get all company financials in excel:


Skanska AB is a Sweden-based construction and project development company. The Company’s operations are divided into four operating segments: Construction, which includes both building construction and civil construction; Residential Development, which develops residential projects for immediate sale; Commercial Property Development, which initiates, develops, leases and divests commercial property projects, and Infrastructure Development, which specializes in identifying, developing and investing in privately financed infrastructure projects, such as highways, hospitals and power generating plants. Skanska AB has operations in the Nordic countries, Poland, the Czech Republic, Hungary and the United States, among others.
Skanska Group has been growing its sales by a year on average in the last 5 years. EBITDA has grown by 0% during that time to total of in 2015, or of sales. That’s compared to % average margin seen in last five years.
The company netted in 2015 implying ROE of and ROCE of . Again, the average figures were 22.2% and 37.5%, respectively when looking at the previous 5 years.
Skanska Group’s net debt amounted to at the end of 2015, or of equity. When compared to EBITDA, net debt was x, up when compared to average of x seen in the last 5 years.
Skanska Group stock traded at per share at the end of 2015 resulting in a market capitalization of . Over the previous five years, stock price grew by 0% or % a year on average. The closing price put stock at a 12-month trailing EV/EBITDA of x and price to earnings (PE) of x as of 2015.
 Helgi Library