By Helgi Library - April 2, 2020
Unipetrol's total assets reached CZK 48,517 mil at the end of 2014, down 2.96% compared to the previous year. Curr...
| Profit Statement |
| Balance Sheet |
| Ratios |
| Valuation |
Get all company financials in excel:
Get all company financials in excel:

Unipetrol is the leading refining and petrochemical Group in the Czech Republic. Dometically, it is the largest crude oil processor, one of the most important plastic producers, and the owner of the largest fuel filling stations network under the brand Benzina. Since 2005, Unipetrol Group has been a part of the biggest refining and petrochemical group in Central Europe - PKN Orlen from Poland. The Group consists of three business segments: refining, petrochemicals and retail distribution of fuels. Unipetrol Group is a leader on the Czech wholesale fuels market. It operates a steam cracker with a downstream polymer production in its Litvínov plant. Benzina network of filling stations was in 2012 with 338 stations and estimated retail market share of 13.7% the biggest player in the Czech Republic. The Group employed approximately 3,700 people at the end of 2012
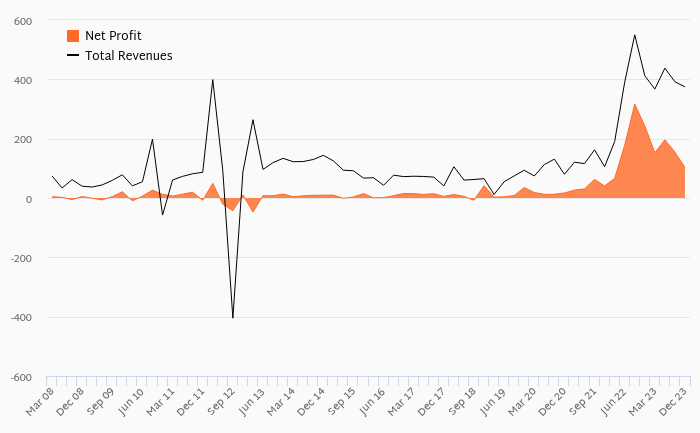
Unipetrol has been growing its sales by a year on average in the last 5 years. EBITDA has grown by 0% during that time to total of in 2015, or of sales. That’s compared to 2.04% average margin seen in last five years.
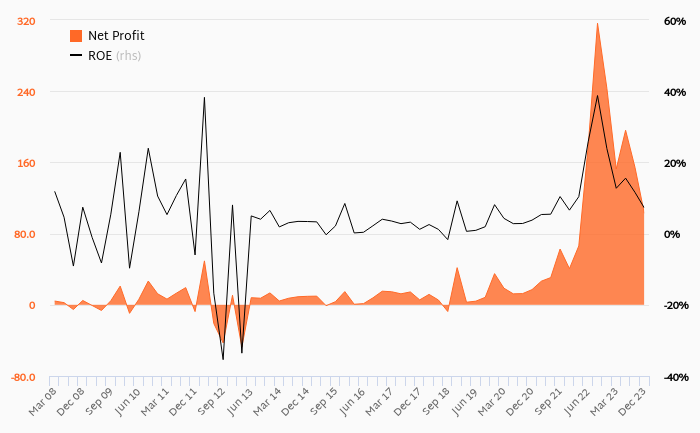
The company netted in 2015 implying ROE of and ROCE of . Again, the average figures were -8.56% and -7.28%, respectively when looking at the previous 5 years.
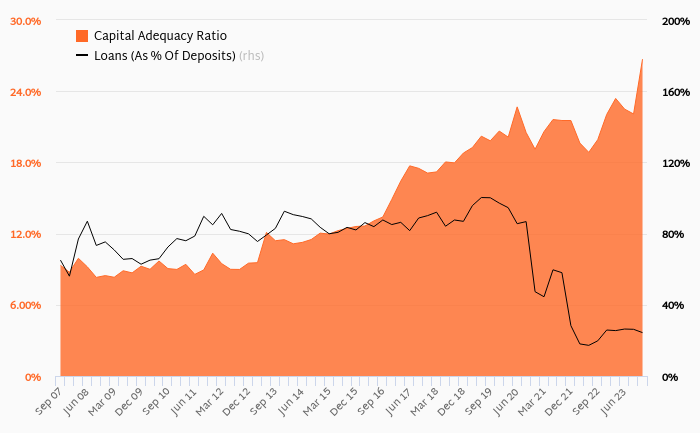
Unipetrol’s net debt amounted to at the end of 2015, or of equity. When compared to EBITDA, net debt was x, down when compared to average of 0.918x seen in the last 5 years.
Unipetrol stock traded at per share at the end of 2015 resulting in a market capitalization of . Over the previous five years, stock price grew by 0% or % a year on average. The closing price put stock at a 12-month trailing EV/EBITDA of x and price to earnings (PE) of x as of 2015.
 Helgi Library