By Helgi Library - March 25, 2024
Coloseum Holding made a net profit of CZK -57.3 mil with revenues of CZK 253 mil in 2022, up by 47.6% and up by 74.4%, ...
By Helgi Library - March 25, 2024
Coloseum Holding stock traded at CZK 244 per share at the end 2022 translating into a market capitalization of USD 8.43 mil. Sinc...
By Helgi Library - March 25, 2024
Coloseum Holding stock traded at CZK 244 per share at the end 2022 translating into a market capitalization of USD 8.43 mil. S...
| Profit Statement | 2025 | 2026 | 2027 | |
| Sales | CZK mil | 349 | 418 | 487 |
| Gross Profit | CZK mil | 135 | 163 | 190 |
| EBITDA | CZK mil | 23.2 | 35.2 | 45.8 |
| EBIT | CZK mil | 9.39 | 20.6 | 30.4 |
| Financing Cost | CZK mil | 5.92 | 5.29 | 4.75 |
| Pre-Tax Profit | CZK mil | -9.50 | 2.33 | 12.6 |
| Net Profit | CZK mil | -8.08 | 1.88 | 10.2 |
| Dividends | CZK mil | 0 | 2.33 | 6.54 |
| Balance Sheet | 2025 | 2026 | 2027 | |
| Total Assets | CZK mil | 228 | 206 | 191 |
| Non-Current Assets | CZK mil | 280 | 277 | 274 |
| Current Assets | CZK mil | -52.3 | -71.1 | -83.8 |
| Working Capital | CZK mil | -23.3 | -25.1 | -30.4 |
| Shareholders' Equity | CZK mil | 97.9 | 97.0 | 102 |
| Liabilities | CZK mil | 136 | 125 | 124 |
| Total Debt | CZK mil | 55.5 | 45.5 | 35.5 |
| Net Debt | CZK mil | 146 | 163 | 172 |
| Ratios | 2025 | 2026 | 2027 | |
| ROE | % | -10.4 | -0.930 | 7.55 |
| ROCE | % | -3.13 | 0.741 | 4.13 |
| Gross Margin | % | 38.8 | 39.0 | 39.0 |
| EBITDA Margin | % | 6.65 | 8.42 | 9.39 |
| EBIT Margin | % | 2.69 | 4.93 | 6.23 |
| Net Margin | % | -2.31 | 0.451 | 2.10 |
| Net Debt/EBITDA | 6.30 | 4.62 | 3.75 | |
| Net Debt/Equity | % | 149 | 168 | 168 |
| Cost of Financing | % | 7.48 | 10.5 | 11.7 |
| Valuation | 2025 | 2026 | 2027 | |
| Market Capitalisation | USD mil | 6.36 | 6.36 | 6.36 |
| Enterprise Value (EV) | USD mil | 12.9 | 13.6 | 14.0 |
| Number Of Shares | mil | 0.862 | 0.862 | 0.862 |
| Share Price | CZK | 165 | 165 | 165 |
| EV/EBITDA | 12.5 | 8.71 | 6.90 | |
| EV/Sales | 0.830 | 0.733 | 0.648 | |
| Price/Earnings (P/E) | -13.3 | -157 | 18.9 | |
| Price/Book Value (P/BV) | 1.45 | 1.47 | 1.39 | |
| Dividend Yield | % | 0 | 1.64 | 4.60 |
Get all company financials in excel:
| overview | Unit | 2015 | 2016 | 2017 | 2018 | 2019 | 2020 | 2021 | 2022 | 2023 | 2024 | 2025 | 2026 | 2027 | 2028 | 2029 | 2030 |
| income statement | |||||||||||||||||
| Sales | CZK mil | 299 | 320 | 352 | 148 | 145 | ... | ... | ... | ||||||||
| Gross Profit | CZK mil | 86.4 | 89.1 | 105 | 10.5 | 23.9 | ... | ... | ... | ||||||||
| EBIT | CZK mil | 7.93 | -2.96 | -5.65 | -13.8 | -1.77 | ... | ... | ... | ||||||||
| Net Profit | CZK mil | ... | 0.721 | -15.8 | -20.4 | -31.3 | -109 | ... | ... | ... | |||||||
| ROE | % | ... | 0.992 | -20.3 | -37.1 | -51.8 | -122 | ... | ... | ... | |||||||
| EBIT Margin | % | 2.66 | -0.926 | -1.61 | -9.35 | -1.22 | ... | ... | ... | ||||||||
| Net Margin | % | 0.241 | -4.94 | -5.80 | -21.2 | -73.7 | ... | ... | ... | ||||||||
| Employees | ... | ... | ... | ... | ... | ... | 105 | ... | ... | ... | ... | ... | ... | ... | ... | ||
| balance sheet | |||||||||||||||||
| Total Assets | CZK mil | 265 | 316 | 356 | 291 | 417 | ... | ... | ... | ||||||||
| Non-Current Assets | CZK mil | 133 | 212 | 231 | 199 | 318 | ... | ... | ... | ||||||||
| Current Assets | CZK mil | 102 | 74.1 | 95.6 | 91.4 | 82.4 | ... | ... | ... | ||||||||
| Shareholders' Equity | CZK mil | 90.5 | 64.9 | 45.1 | 75.9 | 99.3 | ... | ... | ... | ||||||||
| Liabilities | CZK mil | 175 | 251 | 311 | 215 | 313 | ... | ... | ... | ||||||||
| Non-Current Liabilities | CZK mil | 60.0 | 110 | 122 | 115 | 115 | ... | ... | ... | ||||||||
| Current Liabilities | CZK mil | 106 | 139 | 168 | 218 | 198 | ... | ... | ... | ||||||||
| Net Debt/EBITDA | 2.64 | 7.91 | 16.2 | -84.7 | 11.7 | ... | ... | ... | |||||||||
| Net Debt/Equity | % | 32.9 | 134 | 218 | 229 | 149 | ... | ... | ... | ||||||||
| Cost of Financing | % | ... | 4.94 | 6.27 | 6.46 | 5.11 | 4.43 | ... | ... | ... | |||||||
| cash flow | |||||||||||||||||
| Total Cash From Operations | CZK mil | ... | -10.4 | 55.0 | 14.1 | 15.5 | -2.28 | ... | ... | ... | |||||||
| Total Cash From Investing | CZK mil | ... | 28.6 | -93.4 | -30.2 | 17.2 | 23.3 | ... | ... | ... | |||||||
| Total Cash From Financing | CZK mil | ... | 18.9 | 45.1 | 18.6 | 124 | 1.23 | ... | ... | ... | |||||||
| Net Change In Cash | CZK mil | ... | -4.61 | 10.5 | 6.61 | -13.4 | 22.3 | ... | ... | ... | |||||||
| valuation | |||||||||||||||||
| Market Capitalisation | USD mil | ... | ... | ... | ... | ... | 7.99 | 7.78 | ... | ... | ... | ||||||
| Enterprise Value (EV) | USD mil | ... | ... | ... | ... | ... | 16.1 | 14.5 | ... | ... | ... | ||||||
| Number Of Shares | mil | ... | ... | ... | ... | ... | 0.700 | 0.700 | ... | ... | ... | ||||||
| Share Price | CZK | ... | ... | ... | ... | ... | 244 | 244 | ... | ... | ... | ||||||
| Price/Earnings (P/E) | ... | ... | ... | ... | ... | -5.45 | -1.60 | ... | ... | ... | |||||||
| Price/Cash Earnings (P/CE) | ... | ... | ... | ... | ... | -8.73 | -1.85 | ... | ... | ... | |||||||
| EV/EBITDA | ... | ... | ... | ... | ... | -173 | 24.8 | ... | ... | ... | |||||||
| Price/Book Value (P/BV) | ... | ... | ... | ... | ... | 2.25 | 1.72 | ... | ... | ... | |||||||
| Dividend Yield | % | ... | ... | ... | ... | ... | 0 | 0 | ... | ... | ... |
| income statement | Unit | 2015 | 2016 | 2017 | 2018 | 2019 | 2020 | 2021 | 2022 | 2023 | 2024 | 2025 | 2026 | 2027 | 2028 | 2029 | 2030 |
| income statement | |||||||||||||||||
| Sales | CZK mil | 299 | 320 | 352 | 148 | 145 | ... | ... | ... | ||||||||
| Sales from Pizza Coloseum (Stavajici restaurace) | CZK mil | ... | ... | ... | ... | 161 | 68.0 | 68.4 | ... | ... | ... | ||||||
| Sales from Pizza Coloseum (Nove otevrene restaurace) | CZK mil | ... | ... | ... | ... | 0 | 0 | 0 | ... | ... | ... | ||||||
| Sales from Pizza Coloseum (Nove restaurace) | CZK mil | ... | ... | ... | ... | 0 | 0 | 0 | ... | ... | ... | ||||||
| Sales from Catering | CZK mil | ... | ... | ... | ... | 105 | 39.4 | 43.7 | ... | ... | ... | ||||||
| Sales from Pragogastro | CZK mil | ... | ... | ... | ... | 39.3 | 12.2 | 6.26 | ... | ... | ... | ||||||
| Sales from Caffe Pascucci | CZK mil | ... | ... | ... | ... | 0 | 0 | 0 | ... | ... | ... | ||||||
| Sales from Current Business | CZK mil | ... | ... | ... | ... | 305 | 120 | 118 | ... | ... | ... | ||||||
| Sales from New Business | CZK mil | ... | ... | ... | ... | 0 | 0 | 0 | ... | ... | ... | ||||||
| New Business as % of Total Sales | % | ... | ... | ... | ... | 0 | 0 | 0 | ... | ... | ... | ||||||
| Cost of Goods & Services | CZK mil | 212 | 231 | 247 | 137 | 121 | ... | ... | ... | ||||||||
| Cost of Food & Beverages | CZK mil | ... | ... | ... | ... | 90.9 | 41.8 | 84.0 | ... | ... | ... | ||||||
| Cost of Rent & Energy | CZK mil | ... | ... | ... | ... | 42.6 | 36.0 | 30.5 | ... | ... | ... | ||||||
| Gross Profit | CZK mil | 86.4 | 89.1 | 105 | 10.5 | 23.9 | ... | ... | ... | ||||||||
| Staff Cost | CZK mil | 77.5 | 80.5 | 93.3 | 46.6 | 65.2 | ... | ... | ... | ||||||||
| Other Operating Cost (Income) | CZK mil | ... | ... | ... | ... | 5.49 | -34.1 | -17.0 | ... | ... | ... | ||||||
| EBITDA | CZK mil | 11.3 | 11.0 | 6.09 | -2.05 | 12.7 | ... | ... | ... | ||||||||
| EBITDA from Pizza Coloseum (Stavajici restaurace) | CZK mil | ... | ... | ... | ... | 18.0 | -6.92 | -10.1 | ... | ... | ... | ||||||
| EBITDA from Pizza Coloseum (Nove otevrene restaurace) | CZK mil | ... | ... | ... | ... | 0 | 0 | 0 | ... | ... | ... | ||||||
| EBITDA from Pizza Coloseum (Nove restaurace) | CZK mil | ... | ... | ... | ... | 0 | 0 | 0 | ... | ... | ... | ||||||
| EBITDA from Franchising | CZK mil | ... | ... | ... | ... | 4.20 | 2.45 | 2.45 | ... | ... | ... | ||||||
| EBITDA from Catering | CZK mil | ... | ... | ... | ... | 13.2 | -5.09 | -22.7 | ... | ... | ... | ||||||
| EBITDA from Pragogastro | CZK mil | ... | ... | ... | ... | 3.60 | -1.02 | 1.82 | ... | ... | ... | ||||||
| EBITDA from Caffe Pascucci | CZK mil | ... | ... | ... | ... | 0 | 0 | 0 | ... | ... | ... | ||||||
| EBITDA from Current Business | CZK mil | ... | ... | ... | ... | 38.9 | -10.6 | -28.5 | ... | ... | ... | ||||||
| EBITDA from New Business | CZK mil | ... | ... | ... | ... | 0 | 0 | 0 | ... | ... | ... | ||||||
| New Business as % of Total EBITDA | % | ... | ... | ... | ... | 0 | 0 | 0 | ... | ... | ... | ||||||
| Depreciation | CZK mil | ... | 5.07 | 16.5 | 16.3 | 18.8 | 72.2 | ... | ... | ... | |||||||
| EBIT | CZK mil | 7.93 | -2.96 | -5.65 | -13.8 | -1.77 | ... | ... | ... | ||||||||
| Net Financing Cost | CZK mil | 2.28 | 8.75 | 7.34 | 10.4 | 0.212 | ... | ... | ... | ||||||||
| Financing Cost | CZK mil | 3.51 | 5.67 | 8.20 | 8.53 | 8.17 | ... | ... | ... | ||||||||
| Financing Income | CZK mil | 1.58 | 0.296 | 0.818 | 0.673 | 1.06 | ... | ... | ... | ||||||||
| Extraordinary Cost | CZK mil | 1.71 | 2.54 | 0 | 0 | 94.2 | ... | ... | ... | ||||||||
| Pre-Tax Profit | CZK mil | 5.65 | -11.7 | -13.0 | -24.2 | -96.2 | ... | ... | ... | ||||||||
| Tax | CZK mil | 4.29 | 1.90 | 3.35 | 1.49 | -0.618 | ... | ... | ... | ||||||||
| Minorities | CZK mil | -1.07 | -0.353 | -0.518 | -1.41 | -2.33 | ... | ... | ... | ||||||||
| Net Profit | CZK mil | ... | 0.721 | -15.8 | -20.4 | -31.3 | -109 | ... | ... | ... | |||||||
| Net Profit Avail. to Common | CZK mil | 0.721 | -15.8 | -20.4 | -31.3 | -106 | ... | ... | ... | ||||||||
| Dividends | CZK mil | 0 | 0 | 0 | 0 | 0 | ... | ... | ... | ||||||||
| growth rates | |||||||||||||||||
| Total Revenue Growth | % | ... | 71.4 | 7.04 | 10.0 | -58.0 | -1.95 | ... | ... | ... | |||||||
| Staff Cost Growth | % | ... | 168 | 3.87 | 15.8 | -50.0 | 39.7 | ... | ... | ... | |||||||
| EBITDA Growth | % | ... | ... | ... | ... | -44.6 | -134 | -718 | ... | ... | ... | ||||||
| EBIT Growth | % | ... | 174 | -137 | 90.9 | 145 | -87.2 | ... | ... | ... | |||||||
| Pre-Tax Profit Growth | % | ... | 292 | -307 | 11.0 | 86.1 | 298 | ... | ... | ... | |||||||
| Net Profit Growth | % | ... | -350 | -2,290 | 29.2 | 53.5 | 240 | ... | ... | ... | |||||||
| ratios | |||||||||||||||||
| ROE | % | ... | 0.992 | -20.3 | -37.1 | -51.8 | -122 | ... | ... | ... | |||||||
| ROA | % | ... | 0.266 | -5.44 | -6.07 | -9.68 | -30.2 | ... | ... | ... | |||||||
| ROCE | % | ... | 0.412 | -8.40 | -9.47 | -15.4 | -42.6 | ... | ... | ... | |||||||
| Gross Margin | % | 28.9 | 27.9 | 29.8 | 7.13 | 16.5 | ... | ... | ... | ||||||||
| EBITDA Margin | % | 3.78 | 3.44 | 1.73 | -1.39 | 8.76 | ... | ... | ... | ||||||||
| EBITDA Margin from Pizza Coloseum (Stavajici restaurace) | % | ... | ... | ... | ... | 11.1 | -10.2 | -14.7 | ... | ... | ... | ||||||
| EBITDA Margin from Pizza Coloseum (Nove otevrene restaurace) | % | ... | ... | ... | ... | ... | ... | ... | ... | ... | ... | ||||||
| EBITDA Margin from Franchising | % | ... | ... | ... | ... | ... | ... | 2.45 | ... | ... | ... | ||||||
| EBITDA Margin from Catering | % | ... | ... | ... | ... | 12.6 | -12.9 | -51.9 | ... | ... | ... | ||||||
| EBITDA Margin from Pragogastro | % | ... | ... | ... | ... | 9.16 | -8.38 | 29.0 | ... | ... | ... | ||||||
| EBITDA Margin from Caffe Pascucci | % | ... | ... | ... | ... | ... | ... | ... | ... | ... | ... | ||||||
| EBITDA Margin from Current Business | % | ... | ... | ... | ... | 12.8 | -8.85 | -24.1 | ... | ... | ... | ||||||
| EBITDA Margin from New Business | % | ... | ... | ... | ... | 0 | 0 | 0 | ... | ... | ... | ||||||
| EBIT Margin | % | 2.66 | -0.926 | -1.61 | -9.35 | -1.22 | ... | ... | ... | ||||||||
| Net Margin | % | 0.241 | -4.94 | -5.80 | -21.2 | -73.7 | ... | ... | ... | ||||||||
| Payout Ratio | % | 0 | 0 | 0 | 0 | 0 | ... | ... | ... | ||||||||
| Cost of Financing | % | ... | 4.94 | 6.27 | 6.46 | 5.11 | 4.43 | ... | ... | ... | |||||||
| Net Debt/EBITDA | 2.64 | 7.91 | 16.2 | -84.7 | 11.7 | ... | ... | ... |
| balance sheet | Unit | 2015 | 2016 | 2017 | 2018 | 2019 | 2020 | 2021 | 2022 | 2023 | 2024 | 2025 | 2026 | 2027 | 2028 | 2029 | 2030 |
| balance sheet | |||||||||||||||||
| Cash & Cash Equivalents | CZK mil | 20.4 | 30.8 | 37.5 | 24.1 | 22.3 | ... | ... | ... | ||||||||
| Receivables | CZK mil | 71.9 | 34.9 | 49.5 | 58.5 | 54.3 | ... | ... | ... | ||||||||
| Inventories | CZK mil | 7.37 | 8.41 | 8.65 | 8.83 | 5.75 | ... | ... | ... | ||||||||
| Other ST Assets | CZK mil | 0 | 0 | 0 | 0 | 0 | ... | ... | ... | ||||||||
| Current Assets | CZK mil | 102 | 74.1 | 95.6 | 91.4 | 82.4 | ... | ... | ... | ||||||||
| Property, Plant & Equipment | CZK mil | 93.2 | 138 | 158 | 127 | 69.0 | ... | ... | ... | ||||||||
| LT Investments & Receivables | CZK mil | 12.8 | 0 | 0 | 0 | 0 | ... | ... | ... | ||||||||
| Intangible Assets | CZK mil | 0.956 | 0.651 | 0.500 | 52.2 | 49.2 | ... | ... | ... | ||||||||
| Goodwill | CZK mil | 25.8 | 73.7 | 72.6 | 72.6 | 200 | ... | ... | ... | ||||||||
| Non-Current Assets | CZK mil | 133 | 212 | 231 | 199 | 318 | ... | ... | ... | ||||||||
| Total Assets | CZK mil | 265 | 316 | 356 | 291 | 417 | ... | ... | ... | ||||||||
| Trade Payables | CZK mil | 44.0 | 47.8 | 65.6 | 83.9 | 59.4 | ... | ... | ... | ||||||||
| Short-Term Debt | CZK mil | 20.0 | 21.0 | 29.7 | 97.3 | 66.8 | ... | ... | ... | ||||||||
| Other ST Liabilities | CZK mil | 41.6 | 70.6 | 73.2 | 36.5 | 72.0 | ... | ... | ... | ||||||||
| Current Liabilities | CZK mil | 106 | 139 | 168 | 218 | 198 | ... | ... | ... | ||||||||
| Long-Term Debt | CZK mil | 42.9 | 96.7 | 106 | 101 | 104 | ... | ... | ... | ||||||||
| Other LT Liabilities | CZK mil | 17.1 | 13.5 | 16.0 | 13.8 | 11.5 | ... | ... | ... | ||||||||
| Non-Current Liabilities | CZK mil | 60.0 | 110 | 122 | 115 | 115 | ... | ... | ... | ||||||||
| Liabilities | CZK mil | 175 | 251 | 311 | 215 | 313 | ... | ... | ... | ||||||||
| Equity Before Minority Interest | CZK mil | 87.5 | 61.5 | 41.1 | 73.4 | 94.5 | ... | ... | ... | ||||||||
| Minority Interest | CZK mil | -3.06 | -3.41 | -3.93 | -2.50 | -4.83 | ... | ... | ... | ||||||||
| Equity | CZK mil | 90.5 | 64.9 | 45.1 | 75.9 | 99.3 | ... | ... | ... | ||||||||
| growth rates | |||||||||||||||||
| Total Asset Growth | % | ... | -4.38 | 19.2 | 12.8 | -18.4 | 43.6 | ... | ... | ... | |||||||
| Shareholders' Equity Growth | % | ... | 65.3 | -28.3 | -30.6 | 68.4 | 30.8 | ... | ... | ... | |||||||
| Net Debt Growth | % | ... | -820 | 192 | 13.2 | 76.7 | -14.9 | ... | ... | ... | |||||||
| Total Debt Growth | % | ... | -20.4 | 87.2 | 15.4 | 45.7 | -14.0 | ... | ... | ... | |||||||
| ratios | |||||||||||||||||
| Total Debt | CZK mil | 62.9 | 118 | 136 | 198 | 170 | ... | ... | ... | ||||||||
| Net Debt | CZK mil | 29.8 | 86.9 | 98.4 | 174 | 148 | ... | ... | ... | ||||||||
| Working Capital | CZK mil | 35.3 | -4.53 | -7.43 | -16.6 | 0.647 | ... | ... | ... | ||||||||
| Capital Employed | CZK mil | 168 | 208 | 223 | 183 | 318 | ... | ... | ... | ||||||||
| Net Debt/Equity | % | 32.9 | 134 | 218 | 229 | 149 | ... | ... | ... | ||||||||
| Current Ratio | 0.962 | 0.532 | 0.567 | 0.420 | 0.415 | ... | ... | ... | |||||||||
| Quick Ratio | 0.874 | 0.471 | 0.516 | 0.379 | 0.386 | ... | ... | ... |
| cash flow | Unit | 2015 | 2016 | 2017 | 2018 | 2019 | 2020 | 2021 | 2022 | 2023 | 2024 | 2025 | 2026 | 2027 | 2028 | 2029 | 2030 |
| cash flow | |||||||||||||||||
| Net Profit | CZK mil | ... | 0.721 | -15.8 | -20.4 | -31.3 | -109 | ... | ... | ... | |||||||
| Depreciation | CZK mil | ... | 5.07 | 16.5 | 16.3 | 18.8 | 72.2 | ... | ... | ... | |||||||
| Non-Cash Items | CZK mil | ... | -3.00 | -2.00 | -1.00 | 0 | 37.8 | ... | ... | ... | |||||||
| Change in Working Capital | CZK mil | ... | -18.2 | 39.8 | 2.91 | 9.15 | 42.4 | ... | ... | ... | |||||||
| Total Cash From Operations | CZK mil | ... | -10.4 | 55.0 | 14.1 | 15.5 | -2.28 | ... | ... | ... | |||||||
| Capital Expenditures | CZK mil | ... | 28.6 | -93.4 | -30.2 | 17.2 | 23.3 | ... | ... | ... | |||||||
| CAPEX (Caffe Pascucci) | CZK mil | ... | 0 | 0 | 0 | 0 | 0 | ... | ... | ... | |||||||
| Number of new cafes | ... | 0 | 0 | 0 | 0 | 0 | ... | ... | ... | ||||||||
| Cost per new cafe | CZK mil | ... | 0 | 0 | 0 | 0 | 0 | ... | ... | ... | |||||||
| CAPEX (Pizza Coloseum restaurace) | CZK mil | ... | 0 | 0 | 0 | 0 | 0 | ... | ... | ... | |||||||
| Number of new restaurants | ... | 0 | 0 | 0 | 0 | 0 | ... | ... | ... | ||||||||
| Cost per new restaurant | CZK mil | ... | 0 | 0 | 0 | 0 | 0 | ... | ... | ... | |||||||
| CAPEX (Other) | CZK mil | ... | 28.6 | -93.4 | -30.2 | 17.2 | 0 | ... | ... | ... | |||||||
| Net Change in LT Investment | CZK mil | ... | 0 | 0 | 0 | 0 | 0 | ... | ... | ... | |||||||
| Net Cash From Acquisitions | CZK mil | ... | 0 | 0 | 0 | 0 | 0 | ... | ... | ... | |||||||
| Other Investing Activities | CZK mil | ... | 0 | 0 | 0 | 0 | 0 | ... | ... | ... | |||||||
| Total Cash From Investing | CZK mil | ... | 28.6 | -93.4 | -30.2 | 17.2 | 23.3 | ... | ... | ... | |||||||
| Dividends Paid | CZK mil | ... | 0 | 0 | 0 | 0 | 0 | ... | ... | ... | |||||||
| Issuance Of Shares | CZK mil | ... | 35.0 | -9.80 | 0.516 | 62.1 | 0 | ... | ... | ... | |||||||
| Issuance Of Debt | CZK mil | ... | -16.2 | 54.9 | 18.1 | 62.2 | 1.23 | ... | ... | ... | |||||||
| Other Financing Activities | CZK mil | ... | 0 | 0 | 0 | 0 | 0 | ... | ... | ... | |||||||
| Total Cash From Financing | CZK mil | ... | 18.9 | 45.1 | 18.6 | 124 | 1.23 | ... | ... | ... | |||||||
| Net Change In Cash | CZK mil | ... | -4.61 | 10.5 | 6.61 | -13.4 | 22.3 | ... | ... | ... | |||||||
| ratios | |||||||||||||||||
| Days Sales Outstanding | days | 87.9 | 39.8 | 51.3 | 145 | 137 | ... | ... | ... | ||||||||
| Days Sales Of Inventory | days | 12.7 | 13.3 | 12.8 | 23.5 | 17.3 | ... | ... | ... | ||||||||
| Days Payable Outstanding | days | 75.7 | 75.7 | 96.9 | 223 | 179 | ... | ... | ... | ||||||||
| Cash Conversion Cycle | days | 24.9 | -22.5 | -32.8 | -55.2 | -25.1 | ... | ... | ... | ||||||||
| Cash Earnings | CZK mil | 4.08 | -1.84 | -8.66 | -19.6 | -92.3 | ... | ... | ... | ||||||||
| Free Cash Flow | CZK mil | ... | 18.3 | -38.4 | -16.0 | 32.6 | 21.1 | ... | ... | ... | |||||||
| Capital Expenditures (As % of Sales) | % | ... | -9.59 | 29.2 | 8.57 | -11.6 | -16.1 | ... | ... | ... |
| other ratios | Unit | 2015 | 2016 | 2017 | 2018 | 2019 | 2020 | 2021 | 2022 | 2023 | 2024 | 2025 | 2026 | 2027 | 2028 | 2029 | 2030 |
| Employees | ... | ... | ... | ... | ... | ... | 105 | ... | ... | ... | ... | ... | ... | ... | ... | ||
| Cost Per Employee | USD per month | ... | ... | ... | ... | ... | ... | 2,387 | ... | ... | ... | ... | ... | ... | ... | ... | |
| Cost Per Employee (Local Currency) | CZK per month | ... | ... | ... | ... | ... | ... | 51,717 | ... | ... | ... | ... | ... | ... | ... | ... | |
| Staff Cost (As % of Sales) | % | 26.0 | 25.2 | 26.5 | 31.6 | 45.0 | ... | ... | ... | ||||||||
| Effective Tax Rate | % | 76.0 | -16.2 | -25.8 | -6.14 | 0.642 | ... | ... | ... | ||||||||
| Total Revenue Growth (5-year average) | % | ... | ... | ... | ... | ... | 6.27 | -3.63 | ... | ... | ... | ||||||
| Total Revenue Growth (10-year average) | % | ... | ... | ... | ... | ... | ... | ... | ... | ... | ... | ... | ... | ... | |||
| Number of Pizza Restaurants (own) | ... | ... | ... | ... | 6.00 | 6.00 | 6.00 | ... | ... | ... | ... | ... | ... | ... | ... | ||
| Number of Pizza Restaurants (franchising) | ... | ... | ... | ... | ... | ... | -0.373 | ... | ... | ... | |||||||
| Number of Pascucci Points | ... | ... | ... | ... | 0 | 0 | 0 | ... | ... | ... | ... | ... | ... | ... | ... | ... | |
| Number of Catering Units | ... | ... | ... | ... | 5.00 | 5.00 | 5.00 | ... | ... | ... |
| valuation | Unit | 2015 | 2016 | 2017 | 2018 | 2019 | 2020 | 2021 | 2022 | 2023 | 2024 | 2025 | 2026 | 2027 | 2028 | 2029 | 2030 |
| Market Capitalisation | USD mil | ... | ... | ... | ... | ... | 7.99 | 7.78 | ... | ... | ... | ||||||
| Enterprise Value (EV) | USD mil | ... | ... | ... | ... | ... | 16.1 | 14.5 | ... | ... | ... | ||||||
| Number Of Shares | mil | ... | ... | ... | ... | ... | 0.700 | 0.700 | ... | ... | ... | ||||||
| Share Price | CZK | ... | ... | ... | ... | ... | 244 | 244 | ... | ... | ... | ||||||
| EV/EBITDA | ... | ... | ... | ... | ... | -173 | 24.8 | ... | ... | ... | |||||||
| Price/Earnings (P/E) | ... | ... | ... | ... | ... | -5.45 | -1.60 | ... | ... | ... | |||||||
| Price/Cash Earnings (P/CE) | ... | ... | ... | ... | ... | -8.73 | -1.85 | ... | ... | ... | |||||||
| P/FCF | ... | ... | ... | ... | ... | 5.24 | 8.11 | ... | ... | ... | |||||||
| Price/Book Value (P/BV) | ... | ... | ... | ... | ... | 2.25 | 1.72 | ... | ... | ... | |||||||
| Dividend Yield | % | ... | ... | ... | ... | ... | 0 | 0 | ... | ... | ... | ||||||
| Free Cash Flow Yield | % | ... | ... | ... | ... | ... | 18.6 | 12.5 | ... | ... | ... | ||||||
| Earnings Per Share (EPS) | CZK | ... | ... | ... | ... | ... | -44.7 | -152 | ... | ... | ... | ||||||
| Cash Earnings Per Share | CZK | ... | ... | ... | ... | ... | -27.9 | -132 | ... | ... | ... | ||||||
| Free Cash Flow Per Share | CZK | ... | ... | ... | ... | ... | 46.6 | 30.1 | ... | ... | ... | ||||||
| Book Value Per Share | CZK | ... | ... | ... | ... | ... | 108 | 142 | ... | ... | ... | ||||||
| Dividend Per Share | CZK | ... | ... | ... | ... | ... | 0 | 0 | ... | ... | ... | ||||||
| EV/Sales | ... | ... | ... | ... | ... | 2.40 | 2.17 | ... | ... | ... | |||||||
| EV/EBIT | ... | ... | ... | ... | ... | -25.7 | -178 | ... | ... | ... | |||||||
| EV/Free Cash Flow | ... | ... | ... | ... | ... | 10.9 | 15.0 | ... | ... | ... | |||||||
| EV/Capital Employed | ... | ... | ... | ... | ... | 1.89 | 1.00 | ... | ... | ... | |||||||
| Earnings Per Share Growth | % | ... | ... | ... | ... | ... | ... | 240 | ... | ... | ... | ||||||
| Cash Earnings Per Share Growth | % | ... | ... | ... | ... | ... | ... | 372 | ... | ... | ... | ||||||
| Book Value Per Share Growth | % | ... | ... | ... | ... | ... | ... | 30.8 | ... | ... | ... |
| na porici | Unit | 2015 | 2016 | 2017 | 2018 | 2019 | 2020 | 2021 | 2022 | 2023 | 2024 | 2025 | 2026 | 2027 | 2028 | 2029 | 2030 |
| Sales (Na Porici) | CZK mil | ... | ... | ... | ... | 20.6 | 5.73 | 10.0 | |||||||||
| COGS (Na Porici) | CZK mil | ... | ... | ... | ... | 6.06 | 2.49 | 4.00 | |||||||||
| Cost of Rent (Na Porici) | CZK mil | 0 | 0 | 0 | 0 | 0 | |||||||||||
| Personal Cost (Na Porici) | CZK mil | ... | ... | ... | ... | 1.91 | 1.85 | 1.85 | |||||||||
| Other Cost (Na Porici) | CZK mil | ... | ... | ... | ... | 7.74 | 1.15 | 5.00 | |||||||||
| EBITDA (Na Porici) | CZK mil | ... | ... | ... | ... | 1.38 | 1.45 | 1.00 | |||||||||
| Rent Cost as % of Sales (Na Porici) | % | ... | ... | ... | ... | 29.5 | 43.4 | 40.0 | |||||||||
| Personal Cost as % of Sales (Na Porici) | % | ... | ... | ... | ... | 9.28 | 32.3 | 18.5 | |||||||||
| EBITDA Margin (Na Porici) | % | ... | ... | ... | ... | 37.6 | 20.0 | 50.0 | |||||||||
| EBIT Margin (Na Porici) | % | ... | ... | ... | ... | 17.0 | -21.0 | -18.5 |
| pruhonice | Unit | 2015 | 2016 | 2017 | 2018 | 2019 | 2020 | 2021 | 2022 | 2023 | 2024 | 2025 | 2026 | 2027 | 2028 | 2029 | 2030 |
| Sales (Pruhonice) | CZK mil | 0 | 0 | 0 | 0 | 0 | |||||||||||
| Number of Meals Sold (Pruhonice) | '000 | ... | ... | ... | ... | 24.5 | 12.9 | 15.0 | |||||||||
| Cost of Rent (Pruhonice) | CZK mil | ... | ... | ... | ... | 6.32 | 4.60 | 7.50 | |||||||||
| Personal Cost (Pruhonice) | CZK mil | ... | ... | ... | ... | 7.39 | 6.97 | 4.00 | |||||||||
| Other Cost (Pruhonice) | CZK mil | 0 | 0 | 0 | 0 | 0 | |||||||||||
| EBITDA (Pruhonice) | CZK mil | ... | ... | ... | ... | 9.25 | 2.26 | 6.00 | |||||||||
| Food Cost as % of Sales (Pruhonice) | % | ... | ... | ... | ... | ... | ... | 2,391 | |||||||||
| Rent Cost as % of Sales (Pruhonice) | % | ... | ... | ... | ... | ... | ... | -12.5 | |||||||||
| Personal Cost as % of Sales (Pruhonice) | % | ... | ... | ... | ... | 25.7 | 35.8 | 50.0 | |||||||||
| EBITDA Margin (Pruhonice) | % | ... | ... | ... | ... | 30.1 | 54.2 | 26.7 | |||||||||
| EBIT Margin (Pruhonice) | % | ... | ... | ... | ... | 37.7 | 17.5 | 40.0 | |||||||||
| Net Margin (Pruhonice) | % | ... | ... | ... | ... | ... | ... | -20.0 |
| andel | Unit | 2015 | 2016 | 2017 | 2018 | 2019 | 2020 | 2021 | 2022 | 2023 | 2024 | 2025 | 2026 | 2027 | 2028 | 2029 | 2030 |
| Sales (Andel) | CZK mil | 0 | 0 | 0 | 0 | 0 | |||||||||||
| Number of Meals Sold (Andel) | '000 | 0 | 0 | 0 | 0 | 0 | |||||||||||
| Price of Meal (Andel) | CZK | ... | ... | ... | ... | 31.5 | 14.7 | 15.8 | |||||||||
| Personal Cost (Andel) | CZK mil | ... | ... | ... | ... | 8.16 | 5.09 | 6.01 | |||||||||
| Other Cost (Andel) | CZK mil | ... | ... | ... | ... | 4.52 | 3.74 | 3.50 | |||||||||
| EBITDA (Andel) | CZK mil | 0 | 0 | 0 | 0 | 0 | |||||||||||
| Food Cost as % of Sales (Andel) | % | ... | ... | ... | ... | ... | ... | 401 | |||||||||
| Rent Cost as % of Sales (Andel) | % | ... | ... | ... | ... | ... | ... | 765 | |||||||||
| Personal Cost as % of Sales (Andel) | % | ... | ... | ... | ... | ... | ... | -5.33 | |||||||||
| EBITDA Margin (Andel) | % | ... | ... | ... | ... | 25.9 | 34.6 | 38.0 | |||||||||
| EBIT Margin (Andel) | % | ... | ... | ... | ... | 14.3 | 25.4 | 22.1 | |||||||||
| Net Margin (Andel) | % | ... | ... | ... | ... | 23.5 | 9.44 | -1.80 |
| legerova | Unit | 2015 | 2016 | 2017 | 2018 | 2019 | 2020 | 2021 | 2022 | 2023 | 2024 | 2025 | 2026 | 2027 | 2028 | 2029 | 2030 |
| Sales (Legerova) | CZK mil | ... | ... | ... | ... | ... | ... | -0.026 | |||||||||
| Number of Meals Sold (Legerova) | '000 | 0 | 0 | 0 | 0 | 0 | |||||||||||
| Price of Meal (Legerova) | CZK | 0 | 0 | 0 | 0 | 0 | |||||||||||
| Capacity (Legerova) | '000 | ... | ... | ... | ... | 23.2 | 7.17 | 0 | |||||||||
| Other Cost (Legerova) | CZK mil | ... | ... | ... | ... | 6.04 | 2.37 | 0 | |||||||||
| EBITDA (Legerova) | CZK mil | ... | ... | ... | ... | 3.71 | 3.50 | 0 | |||||||||
| EBITDA Margin (Legerova) | % | ... | ... | ... | ... | 26.1 | 33.0 | ... | ... | ... | ... | ... | ... | ... | ... | ... | ... |
| EBIT Margin (Legerova) | % | ... | ... | ... | ... | 16.0 | 48.9 | ... | ... | ... | ... | ... | ... | ... | ... | ... | ... |
| Net Margin (Legerova) | % | ... | ... | ... | ... | 18.5 | -19.2 | ... | ... | ... | ... | ... | ... | ... | ... | ... | ... |
| vysocanska | Unit | 2015 | 2016 | 2017 | 2018 | 2019 | 2020 | 2021 | 2022 | 2023 | 2024 | 2025 | 2026 | 2027 | 2028 | 2029 | 2030 |
| Number of Meals Sold (Vysocanska) | '000 | 0 | 0 | 0 | 0 | 0 | |||||||||||
| Price of Meal (Vysocanska) | CZK | 0 | 0 | 0 | 0 | 0 | |||||||||||
| Capacity (Vysocanska) | '000 | ... | ... | ... | ... | 13.3 | 8.70 | 8.74 | |||||||||
| Other Cost (Vysocanska) | CZK mil | ... | ... | ... | ... | 4.24 | 2.98 | 4.50 | |||||||||
| EBITDA (Vysocanska) | CZK mil | ... | ... | ... | ... | 2.45 | 2.43 | 1.55 | |||||||||
| Food Cost as % of Sales (Vysocanska) | % | ... | ... | ... | ... | ... | ... | 300 | |||||||||
| Rent Cost as % of Sales (Vysocanska) | % | ... | ... | ... | ... | ... | ... | -789 | |||||||||
| Personal Cost as % of Sales (Vysocanska) | % | ... | ... | ... | ... | ... | ... | 18.4 | |||||||||
| EBITDA Margin (Vysocanska) | % | ... | ... | ... | ... | 32.0 | 34.3 | 51.5 | |||||||||
| EBIT Margin (Vysocanska) | % | ... | ... | ... | ... | 18.4 | 27.9 | 17.7 | ... | ... | ... | ... | ... | ... | ... | ||
| Net Margin (Vysocanska) | % | ... | ... | ... | ... | -3.57 | 3.52 | -15.7 | ... | ... | ... | ... | ... | ... | ... |
| ceske budejovice | Unit | 2015 | 2016 | 2017 | 2018 | 2019 | 2020 | 2021 | 2022 | 2023 | 2024 | 2025 | 2026 | 2027 | 2028 | 2029 | 2030 |
| Sales (Ceske Budejovice) | CZK mil | ... | ... | ... | ... | ... | ... | -0.166 | ... | ... | ... | ... | ... | ... | ... | ||
| Number of Meals Sold (Ceske Budejovice) | '000 | 0 | 0 | 0 | 0 | 0 | |||||||||||
| Price of Meal (Ceske Budejovice) | CZK | 0 | 0 | 0 | 0 | 0 | |||||||||||
| Capacity (Ceske Budejovice) | '000 | ... | ... | ... | ... | 10.0 | 8.32 | 7.37 | |||||||||
| Other Cost (Ceske Budejovice) | CZK mil | ... | ... | ... | ... | 3.81 | 3.05 | 3.53 | |||||||||
| EBITDA (Ceske Budejovice) | CZK mil | ... | ... | ... | ... | 2.41 | 2.39 | 1.54 | |||||||||
| Food Cost as % of Sales (Ceske Budejovice) | % | ... | ... | ... | ... | ... | ... | 185 | |||||||||
| Rent Cost as % of Sales (Ceske Budejovice) | % | ... | ... | ... | ... | ... | ... | 0 | |||||||||
| Personal Cost as % of Sales (Ceske Budejovice) | % | ... | ... | ... | ... | ... | ... | -407 | |||||||||
| EBITDA Margin (Ceske Budejovice) | % | ... | ... | ... | ... | ... | ... | 3.59 | |||||||||
| EBIT Margin (Ceske Budejovice) | % | ... | ... | ... | ... | 37.9 | 36.7 | 47.9 | |||||||||
| Net Margin (Ceske Budejovice) | % | ... | ... | ... | ... | 51.5 | 28.2 | 32.0 |
| pivovar narodni | Unit | 2015 | 2016 | 2017 | 2018 | 2019 | 2020 | 2021 | 2022 | 2023 | 2024 | 2025 | 2026 | 2027 | 2028 | 2029 | 2030 |
| Number of Meals Sold (Pivovar Narodni) | '000 | ... | ... | ... | ... | ... | ... | -0.020 | |||||||||
| Price of Meal (Pivovar Narodni) | CZK | 0 | 0 | 0 | 0 | 0 | |||||||||||
| Capacity (Pivovar Narodni) | '000 | 0 | 0 | 0 | 0 | 0 | |||||||||||
| Capacity Utilization (Pivovar Narodni) | % | ... | ... | ... | ... | 3,795 | 1,051 | 1,147 | |||||||||
| EBITDA (Pivovar Narodni) | CZK mil | ... | ... | ... | ... | 9.06 | 3.29 | 4.42 | |||||||||
| Food Cost as % of Sales (Pivovar Narodni) | % | ... | ... | ... | ... | ... | ... | -465 | |||||||||
| Rent Cost as % of Sales (Pivovar Narodni) | % | ... | ... | ... | ... | ... | ... | 2.10 | |||||||||
| Personal Cost as % of Sales (Pivovar Narodni) | % | ... | ... | ... | ... | ... | ... | 654 | |||||||||
| EBITDA Margin (Pivovar Narodni) | % | ... | ... | ... | ... | ... | ... | -965 | |||||||||
| EBIT Margin (Pivovar Narodni) | % | ... | ... | ... | ... | ... | ... | 48.2 | |||||||||
| Net Margin (Pivovar Narodni) | % | ... | ... | ... | ... | 9.22 | 29.6 | 30.5 |
| obcanska plovarna | Unit | 2015 | 2016 | 2017 | 2018 | 2019 | 2020 | 2021 | 2022 | 2023 | 2024 | 2025 | 2026 | 2027 | 2028 | 2029 | 2030 |
| Number of Meals Sold (Obcanska Plovarna) | '000 | 0 | 0 | 0 | 0 | 0 | |||||||||||
| Capacity (Obcanska Plovarna) | '000 | 0 | 0 | 0 | 0 | 0 | |||||||||||
| Capacity Utilization (Obcanska Plovarna) | % | 0 | 0 | 0 | 0 | 1,450 | |||||||||||
| COGS (Obcanska Plovarna) | CZK mil | ... | ... | ... | ... | 22.5 | 9.93 | 14.5 | |||||||||
| Food Cost as % of Sales (Obcanska Plovarna) | % | ... | ... | ... | ... | ... | ... | 339 | |||||||||
| Rent Cost as % of Sales (Obcanska Plovarna) | % | ... | ... | ... | ... | ... | ... | -848 | |||||||||
| Personal Cost as % of Sales (Obcanska Plovarna) | % | ... | ... | ... | ... | ... | ... | 23.1 | |||||||||
| EBITDA Margin (Obcanska Plovarna) | % | ... | ... | ... | ... | ... | ... | 4,565 | |||||||||
| EBIT Margin (Obcanska Plovarna) | % | ... | ... | ... | ... | ... | ... | -3,289 | |||||||||
| Net Margin (Obcanska Plovarna) | % | ... | ... | ... | ... | 27.2 | 33.4 | 41.3 |
| arena liberec | Unit | 2015 | 2016 | 2017 | 2018 | 2019 | 2020 | 2021 | 2022 | 2023 | 2024 | 2025 | 2026 | 2027 | 2028 | 2029 | 2030 |
| Sales (Arena Liberec) | CZK mil | ... | ... | ... | ... | 0.153 | 0.053 | -0.175 | |||||||||
| Number of Meals Sold (Arena Liberec) | '000 | ... | ... | ... | ... | 0.039 | -0.204 | -0.351 | |||||||||
| Price of Meal (Arena Liberec) | CZK | ... | ... | ... | ... | ... | ... | 0.074 | |||||||||
| Capacity (Arena Liberec) | '000 | ... | ... | ... | ... | ... | ... | -0.585 | |||||||||
| Capacity Utilization (Arena Liberec) | % | 0 | 0 | 0 | 0 | 0 | |||||||||||
| COGS (Arena Liberec) | CZK mil | 0 | 0 | 0 | 0 | 18.6 | |||||||||||
| Cost of Rent (Arena Liberec) | CZK mil | ... | ... | ... | ... | 45.8 | 15.8 | 18.6 | |||||||||
| Food Cost as % of Sales (Arena Liberec) | % | ... | ... | ... | ... | 638 | -229 | -1,814 | |||||||||
| Rent Cost as % of Sales (Arena Liberec) | % | ... | ... | ... | ... | ... | ... | -7.90 | |||||||||
| Personal Cost as % of Sales (Arena Liberec) | % | ... | ... | ... | ... | ... | ... | -1,806 | |||||||||
| EBITDA Margin (Arena Liberec) | % | ... | ... | ... | ... | ... | ... | 383 | |||||||||
| EBIT Margin (Arena Liberec) | % | ... | ... | ... | ... | ... | ... | 0 | |||||||||
| Net Margin (Arena Liberec) | % | ... | ... | ... | ... | ... | ... | -380 |
| arena pardubice | Unit | 2015 | 2016 | 2017 | 2018 | 2019 | 2020 | 2021 | 2022 | 2023 | 2024 | 2025 | 2026 | 2027 | 2028 | 2029 | 2030 |
| Sales (Arena Pardubice) | CZK mil | ... | ... | ... | ... | 0.195 | 0.380 | 0.421 | |||||||||
| Number of Meals Sold (Arena Pardubice) | '000 | ... | ... | ... | ... | 0.146 | -0.125 | -0.959 | |||||||||
| Price of Meal (Arena Pardubice) | CZK | ... | ... | ... | ... | 0.140 | -0.145 | -0.976 | |||||||||
| Capacity Utilization (Arena Pardubice) | % | ... | ... | ... | ... | ... | ... | -97.2 | |||||||||
| COGS (Arena Pardubice) | CZK mil | 0 | 0 | 0 | 0 | 0 | |||||||||||
| Cost of Rent (Arena Pardubice) | CZK mil | 0 | 0 | 0 | 0 | 0 | |||||||||||
| Personal Cost (Arena Pardubice) | CZK mil | ... | ... | ... | ... | 13.0 | 5.41 | 9.72 | |||||||||
| Food Cost as % of Sales (Arena Pardubice) | % | ... | ... | ... | ... | 89.6 | -252 | -106 | |||||||||
| Rent Cost as % of Sales (Arena Pardubice) | % | ... | ... | ... | ... | ... | ... | -2.40 | |||||||||
| Personal Cost as % of Sales (Arena Pardubice) | % | ... | ... | ... | ... | ... | ... | -103 | |||||||||
| EBITDA Margin (Arena Pardubice) | % | ... | ... | ... | ... | ... | ... | 165 | |||||||||
| EBIT Margin (Arena Pardubice) | % | ... | ... | ... | ... | ... | ... | 0 | |||||||||
| Net Margin (Arena Pardubice) | % | ... | ... | ... | ... | ... | ... | -57.3 |
| arena kladno | Unit | 2015 | 2016 | 2017 | 2018 | 2019 | 2020 | 2021 | 2022 | 2023 | 2024 | 2025 | 2026 | 2027 | 2028 | 2029 | 2030 |
| Sales (Arena Kladno) | CZK mil | ... | ... | ... | ... | 0.320 | 0.645 | 0.425 | |||||||||
| Number of Meals Sold (Arena Kladno) | '000 | ... | ... | ... | ... | 0.102 | -0.387 | -0.065 | ... | ... | ... | ... | ... | ... | ... | ||
| Price of Meal (Arena Kladno) | CZK | ... | ... | ... | ... | 0.069 | -0.466 | -0.109 | ... | ... | ... | ... | ... | ... | ... | ||
| Capacity Utilization (Arena Kladno) | % | ... | ... | ... | ... | ... | ... | -10.6 | ... | ... | ... | ... | ... | ... | ... | ||
| COGS (Arena Kladno) | CZK mil | 0 | 0 | 0 | 0 | 0 | |||||||||||
| Cost of Rent (Arena Kladno) | CZK mil | 0 | 0 | 0 | 0 | 0 | |||||||||||
| Personal Cost (Arena Kladno) | CZK mil | ... | ... | ... | ... | 3.53 | 2.73 | 0.905 | |||||||||
| Food Cost as % of Sales (Arena Kladno) | % | ... | ... | ... | ... | -98.6 | -78.5 | -73.0 | |||||||||
| Rent Cost as % of Sales (Arena Kladno) | % | ... | ... | ... | ... | ... | ... | 4.10 | |||||||||
| Personal Cost as % of Sales (Arena Kladno) | % | ... | ... | ... | ... | ... | ... | -77.1 | |||||||||
| EBITDA Margin (Arena Kladno) | % | ... | ... | ... | ... | ... | ... | 129 | |||||||||
| EBIT Margin (Arena Kladno) | % | ... | ... | ... | ... | ... | ... | 0 | |||||||||
| Net Margin (Arena Kladno) | % | ... | ... | ... | ... | ... | ... | 56.2 |
| catering | Unit | 2015 | 2016 | 2017 | 2018 | 2019 | 2020 | 2021 | 2022 | 2023 | 2024 | 2025 | 2026 | 2027 | 2028 | 2029 | 2030 |
| Sales (Catering) | CZK mil | ... | ... | ... | ... | 0.224 | 0.514 | 1.02 | ... | ||||||||
| Number of Meals Sold (Catering) | '000 | ... | ... | ... | ... | -0.273 | -0.279 | -0.782 | ... | ... | ... | ... | ... | ... | ... | ... | |
| Price of Meal (Catering) | CZK | ... | ... | ... | ... | -0.279 | -0.287 | -0.807 | ... | ... | ... | ... | ... | ... | ... | ... | |
| Capacity Utilization (Catering) | % | ... | ... | ... | ... | ... | ... | -85.2 | ... | ... | ... | ... | ... | ... | ... | ... | |
| COGS (Catering) | CZK mil | 0 | 0 | 0 | 0 | 0 | |||||||||||
| Cost of Rent (Catering) | CZK mil | 0 | 0 | 0 | 0 | 0 | |||||||||||
| Personal Cost (Catering) | CZK mil | ... | ... | ... | ... | 19.8 | 5.59 | 0 |
| spalicek | Unit | 2015 | 2016 | 2017 | 2018 | 2019 | 2020 | 2021 | 2022 | 2023 | 2024 | 2025 | 2026 | 2027 | 2028 | 2029 | 2030 |
| Sales (Spalicek) | CZK mil | ... | ... | ... | ... | 0.225 | 0.321 | ... | |||||||||
| Number of Meals Sold (Spalicek) | '000 | ... | ... | ... | ... | 0.134 | -0.141 | ... | |||||||||
| Capacity (Spalicek) | '000 | 0 | 0 | 0 | 0 | 0 | |||||||||||
| COGS (Spalicek) | CZK mil | 0 | 0 | 0 | 0 | 0 | |||||||||||
| Cost of Rent (Spalicek) | CZK mil | 0 | 0 | 0 | 0 | 0 | |||||||||||
| Personal Cost (Spalicek) | CZK mil | ... | ... | ... | ... | 0 | 0 | 0 | |||||||||
| Other Cost (Spalicek) | CZK mil | ... | ... | ... | ... | ... | ... | ... | |||||||||
| EBITDA (Spalicek) | CZK mil | ... | ... | ... | ... | ... | ... | ... | |||||||||
| Food Cost as % of Sales (Spalicek) | % | ... | ... | ... | ... | ... | ... | ... |
| arkady pankrac | Unit | 2015 | 2016 | 2017 | 2018 | 2019 | 2020 | 2021 | 2022 | 2023 | 2024 | 2025 | 2026 | 2027 | 2028 | 2029 | 2030 |
| Sales (Arkady Pankrac) | CZK mil | ... | ... | ... | ... | ... | ... | ... | |||||||||
| Capacity (Arkady Pankrac) | '000 | 0 | 0 | 0 | 0 | 0 | |||||||||||
| COGS (Arkady Pankrac) | CZK mil | 0 | 0 | 0 | 0 | 0 | |||||||||||
| Cost of Rent (Arkady Pankrac) | CZK mil | 0 | 0 | 0 | 0 | 0 | |||||||||||
| Personal Cost (Arkady Pankrac) | CZK mil | ... | ... | ... | ... | 0 | 0 | 0 | |||||||||
| Food Cost as % of Sales (Arkady Pankrac) | % | ... | ... | ... | ... | ... | ... | ... | |||||||||
| Rent Cost as % of Sales (Arkady Pankrac) | % | ... | ... | ... | ... | ... | ... | ... |
| vaclavka | Unit | 2015 | 2016 | 2017 | 2018 | 2019 | 2020 | 2021 | 2022 | 2023 | 2024 | 2025 | 2026 | 2027 | 2028 | 2029 | 2030 |
| Sales (Vaclavka) | CZK mil | ... | ... | ... | ... | ... | ... | ... | |||||||||
| Number of Meals Sold (Vaclavka) | '000 | ... | ... | ... | ... | ... | ... | ... | |||||||||
| Price of Meal (Vaclavka) | CZK | ... | ... | ... | ... | ... | ... | ... | |||||||||
| Capacity (Vaclavka) | '000 | ... | ... | ... | ... | ... | ... | ... | |||||||||
| Capacity Utilization (Vaclavka) | % | 0 | 0 | 0 | 0 | 0 | |||||||||||
| Cost of Rent (Vaclavka) | CZK mil | 0 | 0 | 0 | 0 | 0 | |||||||||||
| Personal Cost (Vaclavka) | CZK mil | 0 | 0 | 0 | 0 | 0 | |||||||||||
| Other Cost (Vaclavka) | CZK mil | ... | ... | ... | ... | 0 | 0 | 0 | |||||||||
| Food Cost as % of Sales (Vaclavka) | % | ... | ... | ... | ... | 0 | 0 | 0 | |||||||||
| Rent Cost as % of Sales (Vaclavka) | % | ... | ... | ... | ... | ... | ... | ... | |||||||||
| Personal Cost as % of Sales (Vaclavka) | % | ... | ... | ... | ... | ... | ... | ... |
| no stress | Unit | 2015 | 2016 | 2017 | 2018 | 2019 | 2020 | 2021 | 2022 | 2023 | 2024 | 2025 | 2026 | 2027 | 2028 | 2029 | 2030 |
| Sales (No Stress) | CZK mil | ... | ... | ... | ... | ... | ... | ... | |||||||||
| Number of Meals Sold (No Stress) | '000 | ... | ... | ... | ... | ... | ... | ... | |||||||||
| Price of Meal (No Stress) | CZK | ... | ... | ... | ... | ... | ... | ... | |||||||||
| Capacity (No Stress) | '000 | ... | ... | ... | ... | ... | ... | ... | |||||||||
| Capacity Utilization (No Stress) | % | ... | ... | ... | ... | ... | ... | ... | |||||||||
| COGS (No Stress) | CZK mil | 0 | 0 | 0 | 0 | 0 | |||||||||||
| Personal Cost (No Stress) | CZK mil | 0 | 0 | 0 | 0 | 0 | |||||||||||
| Other Cost (No Stress) | CZK mil | 0 | 0 | 0 | 0 | 0 | |||||||||||
| EBITDA (No Stress) | CZK mil | ... | ... | ... | ... | 0 | 0 | 0 | |||||||||
| Food Cost as % of Sales (No Stress) | % | ... | ... | ... | ... | 0 | 0 | 0 | |||||||||
| Rent Cost as % of Sales (No Stress) | % | ... | ... | ... | ... | 0 | 0 | 0 | |||||||||
| Personal Cost as % of Sales (No Stress) | % | ... | ... | ... | ... | ... | ... | ... | |||||||||
| EBITDA Margin (No Stress) | % | ... | ... | ... | ... | ... | ... | ... | |||||||||
| EBIT Margin (No Stress) | % | ... | ... | ... | ... | ... | ... | ... |
| nove restaurace pizza coloseum | Unit | 2015 | 2016 | 2017 | 2018 | 2019 | 2020 | 2021 | 2022 | 2023 | 2024 | 2025 | 2026 | 2027 | 2028 | 2029 | 2030 |
| Sales (New Restaurants Coloseum) | CZK mil | ... | ... | ... | ... | ... | ... | ... | |||||||||
| Number of Meals Sold (New Restaurants Coloseum) | '000 | ... | ... | ... | ... | ... | ... | ... | |||||||||
| Capacity (New Restaurants Coloseum) | '000 | ... | ... | ... | ... | ... | ... | ... | |||||||||
| Capacity Utilization (New Restaurants Coloseum) | % | 0 | 0 | 0 | 0 | 0 | |||||||||||
| COGS (New Restaurants Coloseum) | CZK mil | 0 | 0 | 0 | 0 | 0 | |||||||||||
| Cost of Rent (New Restaurants Coloseum) | CZK mil | 0 | ... | 0 | 0 | 0 | |||||||||||
| Personal Cost (New Restaurants Coloseum) | CZK mil | 0 | ... | 0 | 0 | 0 | |||||||||||
| Other Cost (New Restaurants Coloseum) | CZK mil | ... | ... | ... | ... | 0 | 0 | 0 | |||||||||
| EBITDA (New Restaurants Coloseum) | CZK mil | 0 | ... | 0 | 0 | 0 | |||||||||||
| Food Cost as % of Sales (New Restaurants Coloseum) | % | ... | ... | ... | ... | ... | ... | ... | |||||||||
| Rent Cost as % of Sales (New Restaurants Coloseum) | % | ... | ... | ... | ... | ... | ... | ... |
| caffe pascucci | Unit | 2015 | 2016 | 2017 | 2018 | 2019 | 2020 | 2021 | 2022 | 2023 | 2024 | 2025 | 2026 | 2027 | 2028 | 2029 | 2030 |
| Number of Meals Sold (Caffe Pascucci) | '000 | ... | ... | ... | ... | ... | ... | ... | ... | ||||||||
| Price of Meal (Caffe Pascucci) | CZK | ... | ... | ... | ... | ... | ... | ... | ... | ||||||||
| Capacity (Caffe Pascucci) | '000 | ... | ... | ... | ... | ... | ... | ... | ... | ||||||||
| Capacity Utilization (Caffe Pascucci) | % | ... | ... | ... | ... | ... | ... | ... | ... | ||||||||
| Cost of Rent (Caffe Pascucci) | CZK mil | 0 | 0 | 0 | 0 | 0 | |||||||||||
| Other Cost (Caffe Pascucci) | CZK mil | 0 | 0 | 0 | 0 | 0 | |||||||||||
| EBITDA (Caffe Pascucci) | CZK mil | 0 | 0 | 0 | 0 | 0 | |||||||||||
| Food Cost as % of Sales (Caffe Pascucci) | % | ... | ... | ... | ... | ... | ... | ... | |||||||||
| Rent Cost as % of Sales (Caffe Pascucci) | % | ... | ... | ... | ... | ... | ... | ... |
| pragogastro | Unit | 2015 | 2016 | 2017 | 2018 | 2019 | 2020 | 2021 | 2022 | 2023 | 2024 | 2025 | 2026 | 2027 | 2028 | 2029 | 2030 |
| Sales (Pragogastro) | CZK mil | ... | ... | ... | ... | ... | ... | ... | |||||||||
| Internal Sales (Pragogastro) | '000 | ... | ... | ... | ... | ... | ... | ... | |||||||||
| Capacity Utilization (Pragogastro) | % | 0 | 0 | 0 | 0 | 0 | |||||||||||
| COGS (Pragogastro) | CZK mil | 0 | 0 | 0 | 0 | 0 | |||||||||||
| Cost of Rent (Pragogastro) | CZK mil | 0 | 0 | 0 | 0 | 0 | |||||||||||
| Personal Cost (Pragogastro) | CZK mil | 0 | 0 | 0 | 0 | 0 | |||||||||||
| Other Cost (Pragogastro) | CZK mil | 0 | 0 | 0 | 0 | 0 | ... | ||||||||||
| EBITDA (Pragogastro) | CZK mil | 0 | 0 | 0 | 0 | ... | |||||||||||
| Food Cost as % of Sales (Pragogastro) | % | ... | ... | ... | ... | 934 | 906 | 282 | |||||||||
| Rent Cost as % of Sales (Pragogastro) | % | ... | ... | ... | ... | 360 | -102 | 182 | |||||||||
| Personal Cost as % of Sales (Pragogastro) | % | ... | ... | ... | ... | 57.8 | 113 | 18.7 | |||||||||
| EBITDA Margin (Pragogastro) | % | ... | ... | ... | ... | 302 | -215 | 163 | |||||||||
| EBIT Margin (Pragogastro) | % | ... | ... | ... | ... | -140 | -53.5 | -4.40 | |||||||||
| Net Margin (Pragogastro) | % | ... | ... | ... | ... | 222 | 263 | 39.9 |
Get all company financials in excel:


By Helgi Library - March 25, 2024
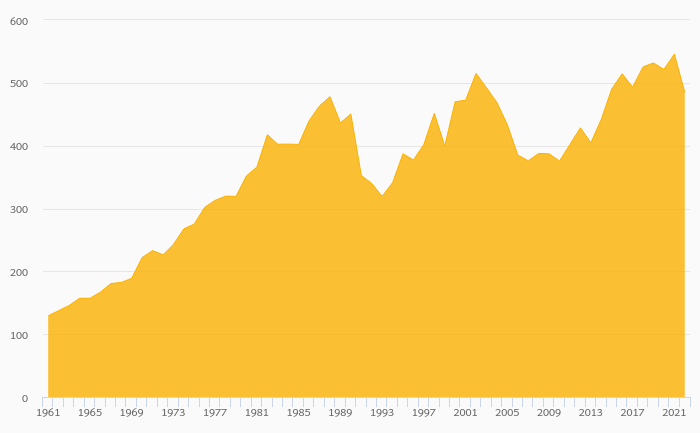
Coloseum Holding made a net profit of CZK -57.3 mil in 2022, up 47.6% compared to the previous year. Historically, between 2016 and 2022, the company's net profit reached a high of CZK 0.721 mil in 2017 and a low of CZK -109 mil in 2021. The result implie...
By Helgi Library - March 25, 2024
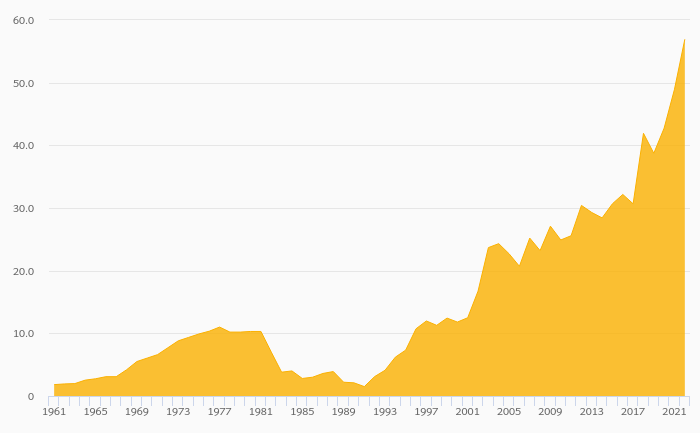
Coloseum Holding's net debt stood at CZK 158 mil and accounted for 98.5% of equity at the end of 2022. The ratio is down 50.7 pp compared to the previous year. Historically, the firm’s net debt to equity reached a high of 229% in 2020 and a low o...
By Helgi Library - March 25, 2024
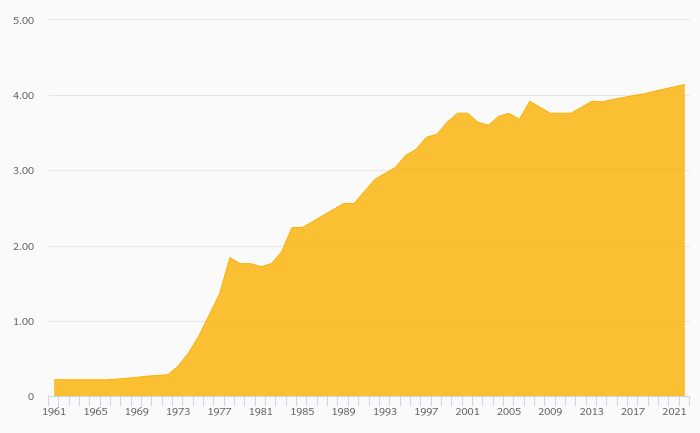
Coloseum Holding made a net profit of CZK -57.3 mil with revenues of CZK 253 mil in 2022, up by 47.6% and up by 74.4%, respectively, compared to the previous year. This translates into a net margin of -22.3%. Historically, between 2015 and 2022, the...
By Helgi Library - March 25, 2024
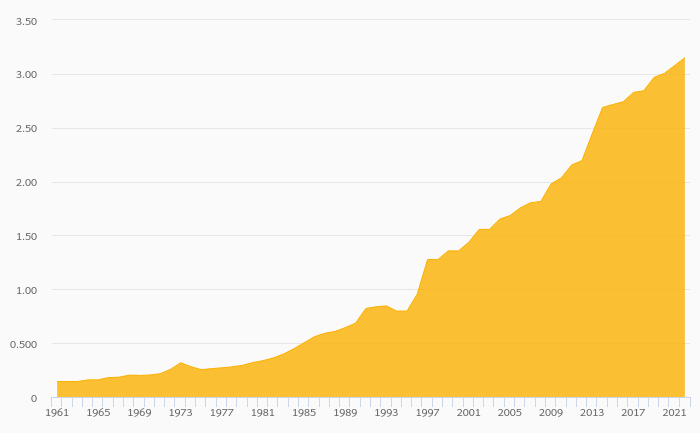
Coloseum Holding invested a total of CZK 10.7 mil in 2022, up 146% compared to the previous year. Historically, between 2016 - 2022, the company's investments stood at a high of CZK 93.4 mil in 2018 and a low of CZK -28.6 mil in 2017. ...
By Helgi Library - March 5, 2024
Coloseum Holding stock traded at CZK 244 per share at the end 2022 implying a market capitalization of USD 8.43 mil. Since the end of 2017, stock has appreciated by % implying an annual average growth of % In absolute terms, the value of the company rose...

Coloseum Holding has been growing its sales by a year on average in the last 5 years. EBITDA has grown by 0% during that time to total of in 2030, or of sales. That’s compared to 8.90% average margin seen in last five years.
The company netted in 2030 implying ROE of and ROCE of . Again, the average figures were 3.31% and 2.44%, respectively when looking at the previous 5 years.
Coloseum Holding’s net debt amounted to at the end of 2030, or of equity. When compared to EBITDA, net debt was x, down when compared to average of 4.19x seen in the last 5 years.
Coloseum Holding stock traded at per share at the end of 2030 resulting in a market capitalization of . Over the previous five years, stock price grew by 0% or % a year on average. The closing price put stock at a 12-month trailing EV/EBITDA of x and price to earnings (PE) of x as of 2030.
 Helgi Library