By Helgi Library - May 18, 2022
Pragogastro made a net profit of CZK 1.14 mil with revenues of CZK 31.3 mil in 2021, up by 168% and down by 43.7%, ...
By Helgi Library - May 18, 2022
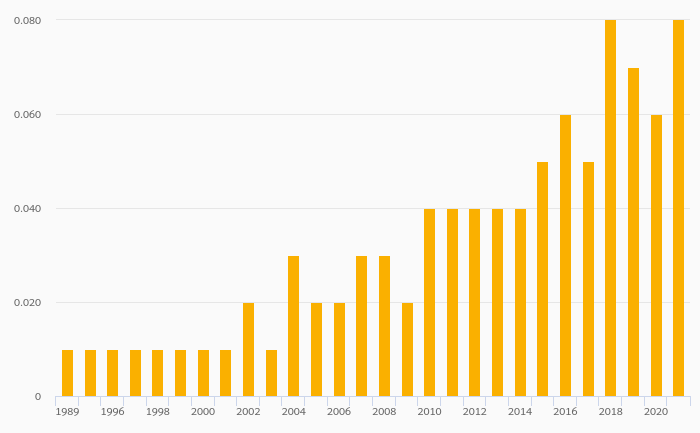
Pragogastro employed 7.00 employees in 2021, down 22.2% compared to the previous year. Historically, between 2015 and 2...
By Helgi Library - May 18, 2022
Pragogastro made a net profit of CZK 1.14 mil with revenues of CZK 31.3 mil in 2021, up by 168% and down by 43.7%, respectiv...
| Profit Statement | 2023 | 2024 | 2025 | |
| Sales | CZK mil | 107 | 131 | 153 |
| Gross Profit | CZK mil | 14.7 | 19.1 | 24.0 |
| EBITDA | CZK mil | 3.64 | 5.88 | 8.06 |
| EBIT | CZK mil | 3.21 | 5.38 | 7.51 |
| Financing Cost | CZK mil | 1.28 | 1.33 | 1.24 |
| Pre-Tax Profit | CZK mil | 1.93 | 4.05 | 6.28 |
| Net Profit | CZK mil | 1.57 | 3.28 | 5.08 |
| Dividends | CZK mil | 0 | 0 | 0 |
| Balance Sheet | 2023 | 2024 | 2025 | |
| Total Assets | CZK mil | 93.7 | 106 | 119 |
| Non-Current Assets | CZK mil | 2.07 | 2.56 | 3.01 |
| Current Assets | CZK mil | 91.7 | 104 | 116 |
| Working Capital | CZK mil | 50.5 | 56.6 | 60.1 |
| Shareholders' Equity | CZK mil | 19.7 | 23.0 | 28.1 |
| Liabilities | CZK mil | 74.0 | 83.4 | 91.2 |
| Total Debt | CZK mil | 26.0 | 27.0 | 28.0 |
| Net Debt | CZK mil | 30.1 | 33.4 | 32.3 |
| Ratios | 2023 | 2024 | 2025 | |
| ROE | % | 8.27 | 15.4 | 19.9 |
| ROCE | % | 3.34 | 5.87 | 8.31 |
| Gross Margin | % | 13.7 | 14.6 | 15.7 |
| EBITDA Margin | % | 3.40 | 4.49 | 5.28 |
| EBIT Margin | % | 3.00 | 4.11 | 4.92 |
| Net Margin | % | 1.46 | 2.51 | 3.33 |
| Net Debt/EBITDA | 8.27 | 5.69 | 4.01 | |
| Net Debt/Equity | % | 153 | 145 | 115 |
| Cost of Financing | % | 5.00 | 5.00 | 4.50 |
| Cash Flow | 2023 | 2024 | 2025 | |
| Total Cash From Operations | CZK mil | -8.84 | -2.33 | 2.10 |
| Total Cash From Investing | CZK mil | -1.00 | -1.00 | -1.00 |
| Total Cash From Financing | CZK mil | 1.00 | 1.00 | 1.00 |
| Net Change In Cash | CZK mil | -8.84 | -2.33 | 2.10 |
| Cash Conversion Cycle | days | 153 | 138 | 123 |
| Cash Earnings | CZK mil | 2.00 | 3.78 | 5.63 |
| Free Cash Flow | CZK mil | -9.84 | -3.33 | 1.10 |
Get all company financials in excel:
| overview | Unit | 2010 | 2011 | 2012 | 2013 | 2014 | 2015 | 2016 | 2017 | 2018 | 2019 | 2020 | 2021 | 2022 | 2023 | 2024 | 2025 |
| income statement | |||||||||||||||||
| Sales | CZK mil | 109 | 121 | 152 | 55.6 | 31.3 | |||||||||||
| Gross Profit | CZK mil | 9.88 | 23.1 | 20.6 | 11.7 | 7.59 | |||||||||||
| EBIT | CZK mil | 4.01 | 3.75 | 3.02 | -2.15 | 1.63 | |||||||||||
| Net Profit | CZK mil | 2.63 | 3.16 | 3.44 | -1.67 | 1.14 | |||||||||||
| ROE | % | ... | 20.7 | 20.2 | 18.8 | -9.01 | 6.21 | ||||||||||
| EBIT Margin | % | 3.68 | 3.11 | 1.99 | -3.87 | 5.21 | |||||||||||
| Net Margin | % | 2.42 | 2.62 | 2.27 | -3.01 | 3.63 | |||||||||||
| Employees | ... | ... | ... | ... | ... | 12.0 | 17.0 | 28.0 | 9.00 | 7.00 | |||||||
| balance sheet | |||||||||||||||||
| Total Assets | CZK mil | 50.7 | 68.3 | 74.0 | 66.0 | 62.1 | |||||||||||
| Non-Current Assets | CZK mil | 2.06 | 1.31 | 1.13 | 0.973 | 0.828 | |||||||||||
| Current Assets | CZK mil | 48.4 | 66.8 | 72.6 | 61.2 | 64.7 | |||||||||||
| Shareholders' Equity | CZK mil | 14.1 | 17.2 | 19.4 | 17.7 | 18.9 | |||||||||||
| Liabilities | CZK mil | 36.7 | 51.1 | 54.5 | 48.2 | 43.2 | |||||||||||
| Non-Current Liabilities | CZK mil | 0.063 | 0.088 | 0.118 | 0.130 | 0.102 | |||||||||||
| Current Liabilities | CZK mil | 36.2 | 48.8 | 52.6 | 47.5 | 43.1 | |||||||||||
| Net Debt/EBITDA | 2.92 | 4.50 | 3.18 | -10.6 | 10.6 | ||||||||||||
| Net Debt/Equity | % | 84.6 | 106 | 59.0 | 61.0 | 102 | |||||||||||
| Cost of Financing | % | ... | ... | ... | 3.78 | 3.22 | 3.40 | 4.22 | 3.55 | ||||||||
| cash flow | |||||||||||||||||
| Total Cash From Operations | CZK mil | ... | 7.59 | -9.20 | 6.99 | 5.56 | -8.93 | ||||||||||
| Total Cash From Investing | CZK mil | ... | 0.314 | 0.453 | -0.399 | -0.967 | -0.042 | ||||||||||
| Total Cash From Financing | CZK mil | ... | -4.39 | 6.27 | -6.47 | -0.204 | 6.25 | ||||||||||
| Net Change In Cash | CZK mil | ... | -0.815 | 0.013 | 1.53 | 0.418 | -2.24 |
| income statement | Unit | 2010 | 2011 | 2012 | 2013 | 2014 | 2015 | 2016 | 2017 | 2018 | 2019 | 2020 | 2021 | 2022 | 2023 | 2024 | 2025 |
| income statement | |||||||||||||||||
| Sales | CZK mil | 109 | 121 | 152 | 55.6 | 31.3 | |||||||||||
| Internal Sales | CZK mil | ... | ... | ... | ... | ... | ... | ... | ... | ... | 55.8 | 22.6 | 23.5 | ||||
| External Sales | CZK mil | ... | ... | ... | ... | ... | ... | ... | ... | ... | 25.0 | 12.0 | 7.75 | ||||
| Cost of Goods & Services | CZK mil | 99.1 | 97.6 | 131 | 43.8 | 23.7 | |||||||||||
| Gross Profit | CZK mil | 9.88 | 23.1 | 20.6 | 11.7 | 7.59 | |||||||||||
| Staff Cost | CZK mil | 3.63 | 5.07 | 7.65 | 3.70 | 2.95 | |||||||||||
| Other Operating Cost (Income) | CZK mil | 2.17 | 14.0 | 9.34 | 9.06 | 2.82 | |||||||||||
| EBITDA | CZK mil | 4.08 | 4.04 | 3.60 | -1.02 | 1.82 | |||||||||||
| Depreciation | CZK mil | 0.071 | 0.289 | 0.578 | 1.13 | 0.187 | |||||||||||
| EBIT | CZK mil | 4.01 | 3.75 | 3.02 | -2.15 | 1.63 | |||||||||||
| Net Financing Cost | CZK mil | -0.085 | -0.316 | -1.40 | -0.535 | -0.044 | |||||||||||
| Financing Cost | CZK mil | 0.559 | 0.506 | 0.553 | 0.572 | 0.589 | |||||||||||
| Financing Income | CZK mil | 0.610 | 0.191 | 0.257 | 0.178 | 0.350 | |||||||||||
| Extraordinary Cost | CZK mil | 0 | 0.009 | 0 | 0 | 0 | |||||||||||
| Pre-Tax Profit | CZK mil | 4.09 | 4.06 | 4.43 | -1.62 | 1.68 | |||||||||||
| Tax | CZK mil | 1.46 | 0.898 | 0.985 | 0.059 | 0.538 | |||||||||||
| Minorities | CZK mil | 0 | 0 | 0 | 0 | 0 | |||||||||||
| Net Profit | CZK mil | 2.63 | 3.16 | 3.44 | -1.67 | 1.14 | |||||||||||
| Net Profit Avail. to Common | CZK mil | 2.63 | 3.16 | 3.44 | -1.67 | 1.14 | |||||||||||
| Dividends | CZK mil | 0 | 0 | 0 | 0 | 0 | |||||||||||
| growth rates | |||||||||||||||||
| Total Revenue Growth | % | ... | 23.9 | 10.7 | 25.7 | -63.4 | -43.7 | ||||||||||
| Staff Cost Growth | % | ... | 19.2 | 40.0 | 50.8 | -51.7 | -20.4 | ||||||||||
| EBITDA Growth | % | ... | ... | ... | ... | -11.0 | -128 | -278 | |||||||||
| EBIT Growth | % | ... | 9.24 | -6.29 | -19.5 | -171 | -176 | ||||||||||
| Pre-Tax Profit Growth | % | ... | 96.2 | -0.733 | 8.96 | -136 | -204 | ||||||||||
| Net Profit Growth | % | ... | 48.2 | 20.1 | 8.76 | -149 | -168 | ||||||||||
| ratios | |||||||||||||||||
| ROE | % | ... | 20.7 | 20.2 | 18.8 | -9.01 | 6.21 | ||||||||||
| ROA | % | ... | 4.92 | 5.31 | 4.84 | -2.39 | 1.78 | ||||||||||
| ROCE | % | ... | 8.51 | 9.23 | 8.90 | -4.93 | 3.17 | ||||||||||
| Gross Margin | % | 9.06 | 19.1 | 13.6 | 21.1 | 24.2 | |||||||||||
| EBITDA Margin | % | 3.74 | 3.35 | 2.37 | -1.84 | 5.81 | |||||||||||
| EBIT Margin | % | 3.68 | 3.11 | 1.99 | -3.87 | 5.21 | |||||||||||
| Net Margin | % | 2.42 | 2.62 | 2.27 | -3.01 | 3.63 | |||||||||||
| Payout Ratio | % | 0 | 0 | 0 | 0 | 0 | |||||||||||
| Cost of Financing | % | ... | ... | ... | 3.78 | 3.22 | 3.40 | 4.22 | 3.55 | ||||||||
| Net Debt/EBITDA | 2.92 | 4.50 | 3.18 | -10.6 | 10.6 |
| balance sheet | Unit | 2010 | 2011 | 2012 | 2013 | 2014 | 2015 | 2016 | 2017 | 2018 | 2019 | 2020 | 2021 | 2022 | 2023 | 2024 | 2025 |
| balance sheet | |||||||||||||||||
| Cash & Cash Equivalents | CZK mil | 0.671 | 0.684 | 2.22 | 2.63 | 0.399 | |||||||||||
| Receivables | CZK mil | 35.5 | 55.6 | 61.3 | 57.5 | 58.1 | |||||||||||
| Inventories | CZK mil | 12.2 | 10.4 | 9.05 | 4.60 | 2.69 | |||||||||||
| Other ST Assets | CZK mil | ... | ... | ... | ... | ... | ... | ... | ... | ... | ... | ... | ... | ||||
| Current Assets | CZK mil | 48.4 | 66.8 | 72.6 | 61.2 | 64.7 | |||||||||||
| Property, Plant & Equipment | CZK mil | 2.06 | 1.31 | 1.13 | 0.973 | 0.828 | |||||||||||
| LT Investments & Receivables | CZK mil | 0 | 0 | 0 | 0 | 0 | |||||||||||
| Non-Current Assets | CZK mil | 2.06 | 1.31 | 1.13 | 0.973 | 0.828 | |||||||||||
| Total Assets | CZK mil | 50.7 | 68.3 | 74.0 | 66.0 | 62.1 | |||||||||||
| Trade Payables | CZK mil | 21.5 | 27.2 | 34.4 | 32.3 | 20.7 | |||||||||||
| Short-Term Debt | CZK mil | 12.6 | 18.9 | 13.7 | 13.3 | 19.6 | |||||||||||
| Other ST Liabilities | CZK mil | 2.17 | 2.73 | 4.57 | 1.93 | 2.78 | |||||||||||
| Current Liabilities | CZK mil | 36.2 | 48.8 | 52.6 | 47.5 | 43.1 | |||||||||||
| Long-Term Debt | CZK mil | 0 | 0 | 0 | 0.130 | 0.102 | |||||||||||
| Other LT Liabilities | CZK mil | 0.063 | 0.088 | 0.118 | 0 | 0 | |||||||||||
| Non-Current Liabilities | CZK mil | 0.063 | 0.088 | 0.118 | 0.130 | 0.102 | |||||||||||
| Liabilities | CZK mil | 36.7 | 51.1 | 54.5 | 48.2 | 43.2 | |||||||||||
| Equity Before Minority Interest | CZK mil | 14.1 | 17.2 | 19.4 | 17.7 | 18.9 | |||||||||||
| Minority Interest | CZK mil | 0 | 0 | 0 | 0 | 0 | |||||||||||
| Equity | CZK mil | 14.1 | 17.2 | 19.4 | 17.7 | 18.9 | |||||||||||
| growth rates | |||||||||||||||||
| Total Asset Growth | % | ... | -9.89 | 34.7 | 8.22 | -10.8 | -5.84 | ||||||||||
| Shareholders' Equity Growth | % | ... | 23.4 | 22.4 | 12.7 | -8.63 | 6.40 | ||||||||||
| Net Debt Growth | % | ... | -23.2 | 52.6 | -37.1 | -5.43 | 78.4 | ||||||||||
| Total Debt Growth | % | ... | ... | ... | ... | -26.0 | 49.9 | -27.6 | -1.49 | 46.4 | |||||||
| ratios | |||||||||||||||||
| Total Debt | CZK mil | 12.6 | 18.9 | 13.7 | 13.5 | 19.7 | |||||||||||
| Net Debt | CZK mil | 11.9 | 18.2 | 11.4 | 10.8 | 19.3 | |||||||||||
| Working Capital | CZK mil | 26.3 | 38.9 | 35.9 | 29.8 | 40.1 | |||||||||||
| Capital Employed | CZK mil | 28.3 | 40.2 | 37.1 | 30.8 | 40.9 | |||||||||||
| Net Debt/Equity | % | 84.6 | 106 | 59.0 | 61.0 | 102 | |||||||||||
| Current Ratio | 1.34 | 1.37 | 1.38 | 1.29 | 1.50 | ||||||||||||
| Quick Ratio | 0.999 | 1.15 | 1.21 | 1.27 | 1.36 |
| cash flow | Unit | 2010 | 2011 | 2012 | 2013 | 2014 | 2015 | 2016 | 2017 | 2018 | 2019 | 2020 | 2021 | 2022 | 2023 | 2024 | 2025 |
| cash flow | |||||||||||||||||
| Net Profit | CZK mil | 2.63 | 3.16 | 3.44 | -1.67 | 1.14 | |||||||||||
| Depreciation | CZK mil | 0.071 | 0.289 | 0.578 | 1.13 | 0.187 | |||||||||||
| Non-Cash Items | CZK mil | ... | 0 | 0 | 0 | 0 | 0 | ||||||||||
| Change in Working Capital | CZK mil | ... | 4.89 | -12.7 | 2.97 | 6.11 | -10.3 | ||||||||||
| Total Cash From Operations | CZK mil | ... | 7.59 | -9.20 | 6.99 | 5.56 | -8.93 | ||||||||||
| Capital Expenditures | CZK mil | ... | 0.314 | 0.453 | -0.399 | -0.967 | -0.042 | ||||||||||
| Other Investing Activities | CZK mil | ... | 0 | 0 | 0 | 0 | 0 | ||||||||||
| Total Cash From Investing | CZK mil | ... | 0.314 | 0.453 | -0.399 | -0.967 | -0.042 | ||||||||||
| Dividends Paid | CZK mil | ... | 0 | 0 | 0 | 0 | 0 | ||||||||||
| Issuance Of Shares | CZK mil | ... | 0.038 | -0.013 | -1.26 | -0.001 | -0.001 | ||||||||||
| Issuance Of Debt | CZK mil | ... | -4.43 | 6.29 | -5.21 | -0.203 | 6.25 | ||||||||||
| Other Financing Activities | CZK mil | ... | -0.276 | -0.466 | -0.856 | 0.966 | 0.041 | ||||||||||
| Total Cash From Financing | CZK mil | ... | -4.39 | 6.27 | -6.47 | -0.204 | 6.25 | ||||||||||
| Net Change In Cash | CZK mil | ... | -0.815 | 0.013 | 1.53 | 0.418 | -2.24 | ||||||||||
| ratios | |||||||||||||||||
| Days Sales Outstanding | days | 119 | 168 | 147 | 378 | 677 | |||||||||||
| Days Sales Of Inventory | days | 44.9 | 39.0 | 25.2 | 38.3 | 41.4 | |||||||||||
| Days Payable Outstanding | days | 79.0 | 102 | 95.7 | 269 | 318 | |||||||||||
| Cash Conversion Cycle | days | 84.8 | 106 | 76.9 | 147 | 400 | |||||||||||
| Cash Earnings | CZK mil | 2.70 | 3.45 | 4.02 | -0.546 | 1.32 | |||||||||||
| Free Cash Flow | CZK mil | ... | 7.91 | -8.75 | 6.59 | 4.60 | -8.97 | ||||||||||
| Capital Expenditures (As % of Sales) | % | ... | -0.288 | -0.375 | 0.263 | 1.74 | 0.134 |
| other ratios | Unit | 2010 | 2011 | 2012 | 2013 | 2014 | 2015 | 2016 | 2017 | 2018 | 2019 | 2020 | 2021 | 2022 | 2023 | 2024 | 2025 |
| Employees | ... | ... | ... | ... | ... | 12.0 | 17.0 | 28.0 | 9.00 | 7.00 | |||||||
| Cost Per Employee | USD per month | ... | ... | ... | ... | ... | 1,073 | 1,137 | 1,010 | 1,557 | 1,619 | ||||||
| Cost Per Employee (Local Currency) | CZK per month | ... | ... | ... | ... | ... | 25,174 | 24,873 | 22,780 | 34,259 | 35,083 | ||||||
| Staff Cost (As % of Sales) | % | 3.33 | 4.20 | 5.04 | 6.66 | 9.42 | |||||||||||
| Effective Tax Rate | % | 35.6 | 22.1 | 22.3 | -3.65 | 32.1 | |||||||||||
| Total Revenue Growth (5-year average) | % | ... | ... | ... | ... | ... | 50.3 | 27.4 | 18.4 | -11.4 | -18.7 | ||||||
| Total Revenue Growth (10-year average) | % | ... | ... | ... | ... | ... | ... | ... | ... | ... | ... | 16.9 | 6.53 |
Get all company financials in excel:
By Helgi Library - May 18, 2022
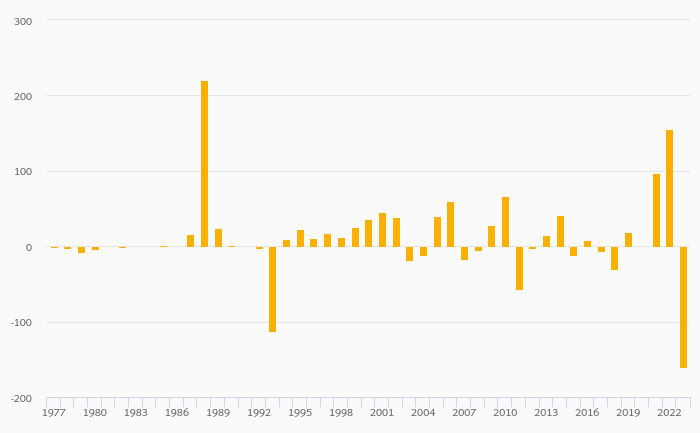
Pragogastro invested a total of CZK 0.042 mil in 2021, down 95.7% compared to the previous year. Historically, between 2011 - 2021, the company's investments stood at a high of CZK 3.20 mil in 2012 and a low of CZK -0.453 mil in 2018. ...
By Helgi Library - May 18, 2022
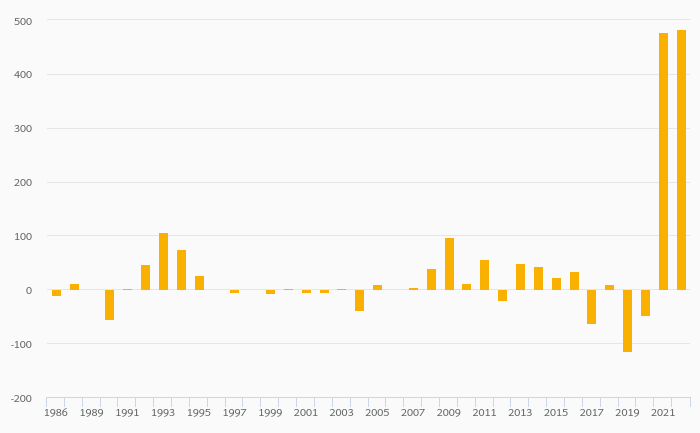
Pragogastro made a net profit of CZK 1.14 mil in 2021, up 168% compared to the previous year. Historically, between 2010 and 2021, the company's net profit reached a high of CZK 3.44 mil in 2019 and a low of CZK -1.67 mil in 2020. The result implies a ret...
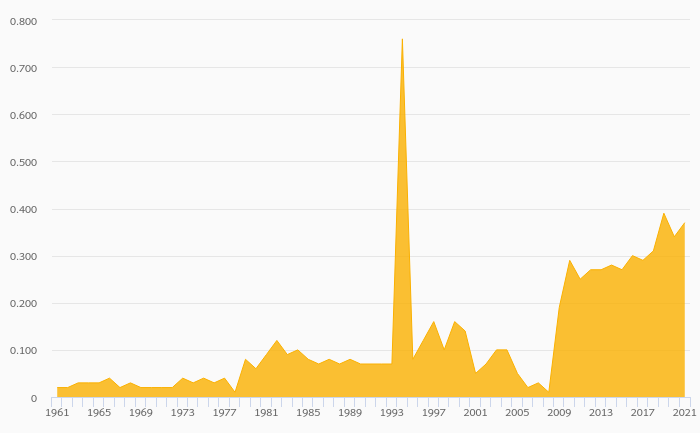
By Helgi Library - May 18, 2022
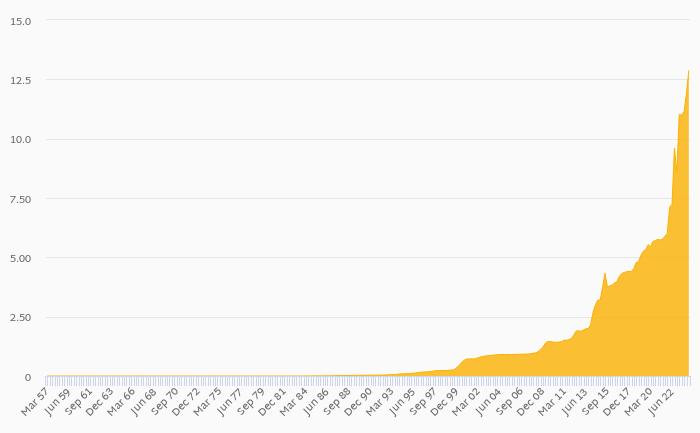
Pragogastro's net debt stood at CZK 19.3 mil and accounted for 102% of equity at the end of 2021. The ratio is up 41.3 pp compared to the previous year. Historically, the firm’s net debt to equity reached a high of 538% in 2013 and a low of -...
Pragogastro has been growing its sales by 22.4% a year on average in the last 5 years. EBITDA has grown by 889% during that time to total of CZK 8.06 mil in 2025, or 5.28% of sales. That’s compared to 3.95% average margin seen in last five years.
The company netted CZK 5.08 mil in 2025 implying ROE of 19.9% and ROCE of 8.31%. Again, the average figures were 9.17% and 3.79%, respectively when looking at the previous 5 years.
Pragogastro’s net debt amounted to CZK 32.3 mil at the end of 2025, or 115% of equity. When compared to EBITDA, net debt was 4.01x, down when compared to average of 13.0x seen in the last 5 years.
 Helgi Library