By Helgi Library - May 1, 2022
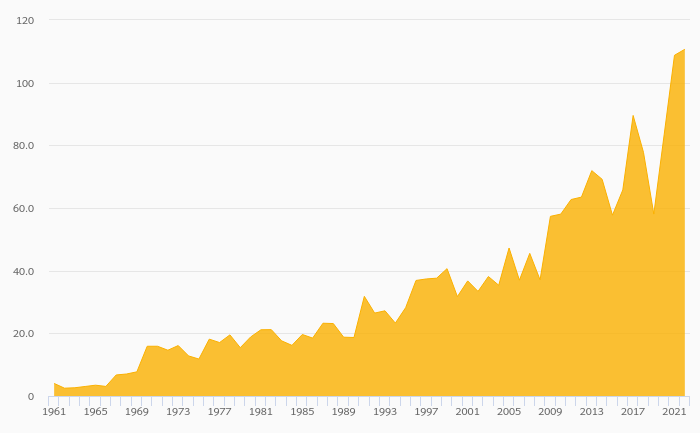
Coloseum Restaurants made a net profit of CZK -63.6 mil with revenues of CZK 145 mil in 2021, down by 103% and down by ...
By Helgi Library - May 1, 2022
Coloseum Restaurants made a net profit of CZK -63.6 mil in 2021, down 103% compared to the previous year. Historically, between ...
By Helgi Library - May 1, 2022
Coloseum Restaurants made a net profit of CZK -63.6 mil with revenues of CZK 145 mil in 2021, down by 103% and down by 1.95%, ...
| Profit Statement | 2025 | 2026 | 2027 | |
| Sales | CZK mil | 741 | 873 | 1,001 |
| Gross Profit | CZK mil | 245 | 283 | 318 |
| EBITDA | CZK mil | 88.3 | 110 | 125 |
| EBIT | CZK mil | 67.9 | 88.7 | 102 |
| Financing Cost | CZK mil | 6.22 | 5.57 | 5.00 |
| Pre-Tax Profit | CZK mil | 54.6 | 76.1 | 90.0 |
| Net Profit | CZK mil | 42.8 | 57.8 | 69.0 |
| Dividends | CZK mil | 0 | 28.9 | 34.5 |
| Balance Sheet | 2025 | 2026 | 2027 | |
| Total Assets | CZK mil | 299 | 352 | 382 |
| Non-Current Assets | CZK mil | 262 | 270 | 278 |
| Current Assets | CZK mil | 37.0 | 81.9 | 104 |
| Working Capital | CZK mil | -1.85 | 13.1 | 32.5 |
| Shareholders' Equity | CZK mil | 35.6 | 93.5 | 134 |
| Liabilities | CZK mil | 263 | 258 | 249 |
| Total Debt | CZK mil | 95.7 | 87.1 | 79.9 |
| Net Debt | CZK mil | 175 | 140 | 128 |
| Ratios | 2025 | 2026 | 2027 | |
| ROE | % | 301 | 89.6 | 60.8 |
| ROCE | % | 17.1 | 21.3 | 23.2 |
| Gross Margin | % | 33.0 | 32.4 | 31.8 |
| EBITDA Margin | % | 11.9 | 12.6 | 12.5 |
| EBIT Margin | % | 9.16 | 10.2 | 10.2 |
| Net Margin | % | 5.78 | 6.63 | 6.90 |
| Net Debt/EBITDA | 1.99 | 1.27 | 1.03 | |
| Net Debt/Equity | % | 492 | 150 | 96.2 |
| Cost of Financing | % | 6.07 | 6.09 | 5.98 |
| Cash Flow | 2025 | 2026 | 2027 | |
| Total Cash From Operations | CZK mil | 60.1 | 71.6 | 79.5 |
| Total Cash From Investing | CZK mil | -35.0 | -36.8 | -38.6 |
| Total Cash From Financing | CZK mil | -13.7 | -8.52 | -36.1 |
| Net Change In Cash | CZK mil | 11.4 | 26.3 | 4.82 |
| Cash Conversion Cycle | days | -15.8 | -5.89 | 3.77 |
| Cash Earnings | CZK mil | 63.2 | 79.5 | 91.9 |
| Free Cash Flow | CZK mil | 25.1 | 34.8 | 40.9 |
Get all company financials in excel:
| overview | Unit | 2015 | 2016 | 2017 | 2018 | 2019 | 2020 | 2021 | 2022 | 2023 | 2024 | 2025 | 2026 | 2027 |
| income statement | ||||||||||||||
| Sales | CZK mil | 299 | 320 | 352 | 148 | 145 | ||||||||
| Gross Profit | CZK mil | 86.4 | 89.1 | 105 | 10.5 | 24.2 | ||||||||
| EBIT | CZK mil | 7.93 | -2.96 | -5.65 | -16.2 | -38.5 | ||||||||
| Net Profit | CZK mil | 0.721 | -15.8 | -20.4 | -31.3 | -63.6 | ||||||||
| ROE | % | ... | 0.992 | -20.3 | -37.1 | -51.8 | -141 | |||||||
| EBIT Margin | % | 2.66 | -0.926 | -1.61 | -11.0 | -26.6 | ||||||||
| Net Margin | % | 0.241 | -4.94 | -5.80 | -21.2 | -43.9 | ||||||||
| balance sheet | ||||||||||||||
| Total Assets | CZK mil | 265 | 316 | 356 | 424 | 332 | ||||||||
| Non-Current Assets | CZK mil | 133 | 212 | 231 | 305 | 233 | ||||||||
| Current Assets | CZK mil | 102 | 74.1 | 95.6 | 91.4 | 82.0 | ||||||||
| Shareholders' Equity | CZK mil | 90.5 | 64.9 | 45.1 | 75.9 | 14.1 | ||||||||
| Liabilities | CZK mil | 175 | 251 | 311 | 348 | 318 | ||||||||
| Non-Current Liabilities | CZK mil | 60.0 | 110 | 122 | 115 | 115 | ||||||||
| Current Liabilities | CZK mil | 106 | 139 | 168 | 218 | 198 | ||||||||
| Net Debt/EBITDA | 2.64 | 7.91 | 16.2 | -84.7 | -7.10 | |||||||||
| Net Debt/Equity | % | 32.9 | 134 | 218 | 229 | 1,213 | ||||||||
| Cost of Financing | % | ... | 4.94 | 6.27 | 6.46 | 5.11 | 4.18 | |||||||
| cash flow | ||||||||||||||
| Total Cash From Operations | CZK mil | ... | -10.4 | 55.0 | 14.1 | 15.5 | 3.59 | |||||||
| Total Cash From Investing | CZK mil | ... | 28.6 | -93.4 | -30.2 | -88.3 | 57.8 | |||||||
| Total Cash From Financing | CZK mil | ... | 18.9 | 45.1 | 18.6 | 124 | -5.52 | |||||||
| Net Change In Cash | CZK mil | ... | -4.61 | 10.5 | 6.61 | -13.4 | -2.15 |
| income statement | Unit | 2015 | 2016 | 2017 | 2018 | 2019 | 2020 | 2021 | 2022 | 2023 | 2024 | 2025 | 2026 | 2027 |
| income statement | ||||||||||||||
| Sales | CZK mil | 299 | 320 | 352 | 148 | 145 | ||||||||
| Sales from Pizza Coloseum (Stavajici restaurace) | CZK mil | ... | ... | ... | ... | 161 | 68.0 | 68.4 | ||||||
| Sales from Pizza Coloseum (Restaurace v jednani) | CZK mil | ... | ... | ... | ... | 0 | 0 | 0 | ||||||
| Sales from Pizza Coloseum (Nove restaurace) | CZK mil | ... | ... | ... | ... | 0 | 0 | 0 | ||||||
| Sales from Catering | CZK mil | ... | ... | ... | ... | 105 | 39.4 | 43.7 | ||||||
| Sales from Pragogastro | CZK mil | ... | ... | ... | ... | 39.3 | 12.2 | 6.26 | ||||||
| Sales from Caffe Pascucci | CZK mil | ... | ... | ... | ... | 0 | 0 | 0 | ||||||
| Sales from Current Business | CZK mil | ... | ... | ... | ... | 305 | 120 | 118 | ||||||
| Sales from New Business | CZK mil | ... | ... | ... | ... | 0 | 0 | 0 | ||||||
| New Business as % of Total Sales | % | ... | ... | ... | ... | 0 | 0 | 0 | ||||||
| Cost of Goods & Services | CZK mil | 212 | 231 | 247 | 137 | 121 | ||||||||
| Cost of Food & Beverages | CZK mil | ... | ... | ... | ... | 90.9 | 41.8 | 84.0 | ||||||
| Cost of Rent & Energy | CZK mil | ... | ... | ... | ... | 42.6 | 34.0 | 26.5 | ||||||
| Gross Profit | CZK mil | 86.4 | 89.1 | 105 | 10.5 | 24.2 | ||||||||
| Staff Cost | CZK mil | 77.5 | 80.5 | 93.3 | 46.6 | 65.2 | ||||||||
| Other Operating Cost (Income) | CZK mil | ... | ... | ... | ... | ... | ... | ... | ||||||
| EBITDA | CZK mil | 11.3 | 11.0 | 6.09 | -2.05 | -24.0 | ||||||||
| EBITDA from Pizza Coloseum (Stavajici restaurace) | CZK mil | ... | ... | ... | ... | 18.0 | -6.92 | -10.1 | ||||||
| EBITDA from Pizza Coloseum (Restaurace v jednani) | CZK mil | ... | ... | ... | ... | 0 | 0 | 0 | ||||||
| EBITDA from Pizza Coloseum (Nove restaurace) | CZK mil | ... | ... | ... | ... | 0 | 0 | 0 | ||||||
| EBITDA from Franchising | CZK mil | ... | ... | ... | ... | 4.20 | 2.45 | 2.45 | ||||||
| EBITDA from Catering | CZK mil | ... | ... | ... | ... | 13.2 | -5.09 | -22.7 | ||||||
| EBITDA from Pragogastro | CZK mil | ... | ... | ... | ... | 3.60 | -1.02 | 1.82 | ||||||
| EBITDA from Caffe Pascucci | CZK mil | ... | ... | ... | ... | 0 | 0 | 0 | ||||||
| EBITDA from Current Business | CZK mil | ... | ... | ... | ... | 38.9 | -10.6 | -28.5 | ||||||
| EBITDA from New Business | CZK mil | ... | ... | ... | ... | 0 | 0 | 0 | ||||||
| New Business as % of Total EBITDA | % | ... | ... | ... | ... | 0 | 0 | 0 | ||||||
| Depreciation | CZK mil | 3.36 | 14.0 | 11.7 | 14.1 | 14.5 | ||||||||
| EBIT | CZK mil | 7.93 | -2.96 | -5.65 | -16.2 | -38.5 | ||||||||
| Net Financing Cost | CZK mil | 2.28 | 8.75 | 7.34 | 10.4 | 0.212 | ||||||||
| Financing Cost | CZK mil | 3.51 | 5.67 | 8.20 | 8.53 | 8.17 | ||||||||
| Financing Income | CZK mil | 1.58 | 0.296 | 0.818 | 0.673 | 1.06 | ||||||||
| Extraordinary Cost | CZK mil | 1.71 | 2.54 | 4.58 | 4.68 | 27.8 | ||||||||
| Pre-Tax Profit | CZK mil | 5.65 | -11.7 | -13.0 | -24.2 | -59.2 | ||||||||
| Tax | CZK mil | 4.29 | 1.90 | 3.35 | 1.49 | -0.618 | ||||||||
| Minorities | CZK mil | -1.07 | -0.353 | -0.518 | -1.41 | -2.33 | ||||||||
| Net Profit | CZK mil | 0.721 | -15.8 | -20.4 | -31.3 | -63.6 | ||||||||
| Net Profit Avail. to Common | CZK mil | 0.721 | -15.8 | -20.4 | -31.3 | -63.6 | ||||||||
| Dividends | CZK mil | 0 | 0 | 0 | 0 | 0 | ||||||||
| growth rates | ||||||||||||||
| Total Revenue Growth | % | ... | 71.4 | 7.04 | 10.0 | -58.0 | -1.95 | |||||||
| Staff Cost Growth | % | ... | 168 | 3.87 | 15.8 | -50.0 | 39.7 | |||||||
| EBITDA Growth | % | ... | ... | ... | ... | -44.6 | -134 | 1,070 | ||||||
| EBIT Growth | % | ... | 174 | -137 | 90.9 | 186 | 138 | |||||||
| Pre-Tax Profit Growth | % | ... | 292 | -307 | 11.0 | 86.1 | 145 | |||||||
| Net Profit Growth | % | ... | -350 | -2,290 | 29.2 | 53.5 | 103 | |||||||
| ratios | ||||||||||||||
| ROE | % | ... | 0.992 | -20.3 | -37.1 | -51.8 | -141 | |||||||
| ROA | % | ... | 0.266 | -5.44 | -6.07 | -8.02 | -16.8 | |||||||
| ROCE | % | ... | 0.412 | -8.40 | -9.47 | -12.2 | -24.4 | |||||||
| Gross Margin | % | 28.9 | 27.9 | 29.8 | 7.13 | 16.7 | ||||||||
| EBITDA Margin | % | 3.78 | 3.44 | 1.73 | -1.39 | -16.6 | ||||||||
| EBITDA Margin from Pizza Coloseum (Stavajici restaurace) | % | ... | ... | ... | ... | 11.1 | -10.2 | -14.7 | ||||||
| EBITDA Margin from Pizza Coloseum (Restaurace v jednani) | % | ... | ... | ... | ... | ... | ... | ... | ||||||
| EBITDA Margin from Pizza Coloseum (Nove restaurace) | % | ... | ... | ... | ... | ... | ... | ... | ... | |||||
| EBITDA Margin from Franchising | % | ... | ... | ... | ... | ... | ... | 2.45 | ||||||
| EBITDA Margin from Catering | % | ... | ... | ... | ... | 12.6 | -12.9 | -51.9 | ||||||
| EBITDA Margin from Pragogastro | % | ... | ... | ... | ... | 9.16 | -8.38 | 29.0 | ||||||
| EBITDA Margin from Caffe Pascucci | % | ... | ... | ... | ... | ... | ... | ... | ||||||
| EBITDA Margin from Current Business | % | ... | ... | ... | ... | 12.8 | -8.85 | -24.1 | ||||||
| EBITDA Margin from New Business | % | ... | ... | ... | ... | 0 | 0 | 0 | ||||||
| EBIT Margin | % | 2.66 | -0.926 | -1.61 | -11.0 | -26.6 | ||||||||
| Net Margin | % | 0.241 | -4.94 | -5.80 | -21.2 | -43.9 | ||||||||
| Payout Ratio | % | 0 | 0 | 0 | 0 | 0 | ||||||||
| Cost of Financing | % | ... | 4.94 | 6.27 | 6.46 | 5.11 | 4.18 | |||||||
| Net Debt/EBITDA | 2.64 | 7.91 | 16.2 | -84.7 | -7.10 |
| balance sheet | Unit | 2015 | 2016 | 2017 | 2018 | 2019 | 2020 | 2021 | 2022 | 2023 | 2024 | 2025 | 2026 | 2027 |
| balance sheet | ||||||||||||||
| Cash & Cash Equivalents | CZK mil | 20.4 | 30.8 | 37.5 | 24.1 | 21.9 | ||||||||
| Receivables | CZK mil | 71.9 | 34.9 | 49.5 | 58.5 | 54.3 | ||||||||
| Inventories | CZK mil | 7.37 | 8.41 | 8.65 | 8.83 | 5.75 | ||||||||
| Other ST Assets | CZK mil | 0 | 0 | 0 | 0 | 0 | ||||||||
| Current Assets | CZK mil | 102 | 74.1 | 95.6 | 91.4 | 82.0 | ||||||||
| Property, Plant & Equipment | CZK mil | 93.2 | 138 | 158 | 127 | 69.0 | ||||||||
| LT Investments & Receivables | CZK mil | 12.8 | 0 | 0 | 0 | 0 | ||||||||
| Intangible Assets | CZK mil | 0.956 | 0.651 | 0.500 | 52.2 | 49.2 | ||||||||
| Goodwill | CZK mil | 25.8 | 73.7 | 72.6 | 126 | 114 | ||||||||
| Non-Current Assets | CZK mil | 133 | 212 | 231 | 305 | 233 | ||||||||
| Total Assets | CZK mil | 265 | 316 | 356 | 424 | 332 | ||||||||
| Trade Payables | CZK mil | 44.0 | 47.8 | 65.6 | 83.9 | 59.2 | ||||||||
| Short-Term Debt | CZK mil | 20.0 | 21.0 | 29.7 | 97.3 | 88.9 | ||||||||
| Other ST Liabilities | CZK mil | 41.6 | 70.6 | 73.2 | 36.5 | 49.7 | ||||||||
| Current Liabilities | CZK mil | 106 | 139 | 168 | 218 | 198 | ||||||||
| Long-Term Debt | CZK mil | 42.9 | 96.7 | 106 | 101 | 104 | ||||||||
| Other LT Liabilities | CZK mil | 17.1 | 13.5 | 16.0 | 13.8 | 11.5 | ||||||||
| Non-Current Liabilities | CZK mil | 60.0 | 110 | 122 | 115 | 115 | ||||||||
| Liabilities | CZK mil | 175 | 251 | 311 | 348 | 318 | ||||||||
| Equity Before Minority Interest | CZK mil | 87.5 | 61.5 | 41.1 | 73.4 | 9.24 | ||||||||
| Minority Interest | CZK mil | -3.06 | -3.41 | -3.93 | -2.50 | -4.83 | ||||||||
| Equity | CZK mil | 90.5 | 64.9 | 45.1 | 75.9 | 14.1 | ||||||||
| growth rates | ||||||||||||||
| Total Asset Growth | % | ... | -4.38 | 19.2 | 12.8 | 19.0 | -21.8 | |||||||
| Shareholders' Equity Growth | % | ... | 65.3 | -28.3 | -30.6 | 68.4 | -81.5 | |||||||
| Net Debt Growth | % | ... | -820 | 192 | 13.2 | 76.7 | -1.94 | |||||||
| Total Debt Growth | % | ... | -20.4 | 87.2 | 15.4 | 45.7 | -2.79 | |||||||
| ratios | ||||||||||||||
| Total Debt | CZK mil | 62.9 | 118 | 136 | 198 | 193 | ||||||||
| Net Debt | CZK mil | 29.8 | 86.9 | 98.4 | 174 | 171 | ||||||||
| Working Capital | CZK mil | 35.3 | -4.53 | -7.43 | -16.6 | 0.844 | ||||||||
| Capital Employed | CZK mil | 168 | 208 | 223 | 288 | 233 | ||||||||
| Net Debt/Equity | % | 32.9 | 134 | 218 | 229 | 1,213 | ||||||||
| Current Ratio | 0.962 | 0.532 | 0.567 | 0.420 | 0.414 | |||||||||
| Quick Ratio | 0.874 | 0.471 | 0.516 | 0.379 | 0.385 |
| cash flow | Unit | 2015 | 2016 | 2017 | 2018 | 2019 | 2020 | 2021 | 2022 | 2023 | 2024 | 2025 | 2026 | 2027 |
| cash flow | ||||||||||||||
| Net Profit | CZK mil | 0.721 | -15.8 | -20.4 | -31.3 | -63.6 | ||||||||
| Depreciation | CZK mil | 3.36 | 14.0 | 11.7 | 14.1 | 14.5 | ||||||||
| Non-Cash Items | CZK mil | ... | -3.00 | -2.00 | -1.00 | 0 | 0 | |||||||
| Change in Working Capital | CZK mil | ... | -18.2 | 39.8 | 2.91 | 9.15 | -17.4 | |||||||
| Total Cash From Operations | CZK mil | ... | -10.4 | 55.0 | 14.1 | 15.5 | 3.59 | |||||||
| Capital Expenditures | CZK mil | ... | 28.6 | -93.4 | -30.2 | -88.3 | 57.8 | |||||||
| CAPEX (Caffe Pascucci) | CZK mil | ... | 0 | 0 | 0 | 0 | 0 | |||||||
| Number of new Caffes | ... | 0 | 0 | 0 | 0 | 0 | ||||||||
| Cost per new Caffe | CZK mil | ... | 0 | 0 | 0 | 0 | 0 | |||||||
| CAPEX (Pizza Coloseum restaurace) | CZK mil | ... | 0 | 0 | 0 | 0 | 0 | |||||||
| Number of new restaurants | ... | 0 | 0 | 0 | 0 | 0 | ||||||||
| Cost per new restaurant | CZK mil | ... | 0 | 0 | 0 | 0 | 5.00 | |||||||
| CAPEX (Other) | CZK mil | ... | 28.6 | -93.4 | -30.2 | -88.3 | -5.00 | |||||||
| Net Change in LT Investment | CZK mil | ... | 0 | 0 | 0 | 0 | 0 | |||||||
| Net Cash From Acquisitions | CZK mil | ... | 0 | 0 | 0 | 0 | 0 | |||||||
| Other Investing Activities | CZK mil | ... | 0 | 0 | 0 | 0 | 0 | |||||||
| Total Cash From Investing | CZK mil | ... | 28.6 | -93.4 | -30.2 | -88.3 | 57.8 | |||||||
| Dividends Paid | CZK mil | ... | 0 | 0 | 0 | 0 | 0 | |||||||
| Issuance Of Shares | CZK mil | ... | 35.0 | -9.80 | 0.516 | 62.1 | 0 | |||||||
| Issuance Of Debt | CZK mil | ... | -16.2 | 54.9 | 18.1 | 62.2 | -5.52 | |||||||
| Other Financing Activities | CZK mil | ... | 0 | 0 | 0 | 0 | 0 | |||||||
| Total Cash From Financing | CZK mil | ... | 18.9 | 45.1 | 18.6 | 124 | -5.52 | |||||||
| Net Change In Cash | CZK mil | ... | -4.61 | 10.5 | 6.61 | -13.4 | -2.15 | |||||||
| ratios | ||||||||||||||
| Days Sales Outstanding | days | 87.9 | 39.8 | 51.3 | 145 | 137 | ||||||||
| Days Sales Of Inventory | days | 12.7 | 13.3 | 12.8 | 23.5 | 17.4 | ||||||||
| Days Payable Outstanding | days | 75.7 | 75.7 | 96.9 | 223 | 179 | ||||||||
| Cash Conversion Cycle | days | 24.9 | -22.5 | -32.8 | -55.2 | -24.9 | ||||||||
| Cash Earnings | CZK mil | 4.08 | -1.84 | -8.66 | -17.2 | -49.1 | ||||||||
| Free Cash Flow | CZK mil | ... | 18.3 | -38.4 | -16.0 | -72.9 | 61.4 | |||||||
| Capital Expenditures (As % of Sales) | % | ... | -9.59 | 29.2 | 8.57 | 59.8 | -39.9 |
| other ratios | Unit | 2015 | 2016 | 2017 | 2018 | 2019 | 2020 | 2021 | 2022 | 2023 | 2024 | 2025 | 2026 | 2027 |
| Staff Cost (As % of Sales) | % | 26.0 | 25.2 | 26.5 | 31.6 | 45.0 | ||||||||
| Effective Tax Rate | % | 76.0 | -16.2 | -25.8 | -6.14 | 1.04 | ||||||||
| Total Revenue Growth (5-year average) | % | ... | ... | ... | ... | ... | 6.27 | -3.63 | ||||||
| Total Revenue Growth (10-year average) | % | ... | ... | ... | ... | ... | ... | ... | ... | ... | ... | |||
| Number of Pizza Restaurants (own) | ... | ... | ... | ... | 6.00 | 6.00 | 6.00 | |||||||
| Number of Pizza Restaurants (franchising) | ... | ... | ... | ... | 5.00 | 6.00 | 5.00 | |||||||
| Number of Pascucci Points | ... | ... | ... | ... | 0 | 0 | 0 | |||||||
| Number of Catering Units | ... | ... | ... | ... | 5.00 | 5.00 | 5.00 |
| na porici | Unit | 2015 | 2016 | 2017 | 2018 | 2019 | 2020 | 2021 | 2022 | 2023 | 2024 | 2025 | 2026 | 2027 |
| Sales (Na Porici) | CZK mil | ... | ... | ... | ... | 20.6 | 5.73 | 10.0 | ||||||
| COGS (Na Porici) | CZK mil | ... | ... | ... | ... | 6.06 | 2.49 | 4.00 | ||||||
| Cost of Rent (Na Porici) | CZK mil | ... | ... | ... | ... | 1.91 | 1.85 | 1.85 | ||||||
| Personal Cost (Na Porici) | CZK mil | ... | ... | ... | ... | 7.74 | 1.15 | 5.00 | ||||||
| Other Cost (Na Porici) | CZK mil | ... | ... | ... | ... | 1.38 | 1.45 | 1.00 | ||||||
| EBITDA (Na Porici) | CZK mil | ... | ... | ... | ... | 3.49 | -1.20 | -1.85 | ||||||
| Food Cost as % of Sales (Na Porici) | % | ... | ... | ... | ... | 29.5 | 43.4 | 40.0 | ||||||
| Rent Cost as % of Sales (Na Porici) | % | ... | ... | ... | ... | 9.28 | 32.3 | 18.5 | ||||||
| Personal Cost as % of Sales (Na Porici) | % | ... | ... | ... | ... | 37.6 | 20.0 | 50.0 | ||||||
| EBITDA Margin (Na Porici) | % | ... | ... | ... | ... | 17.0 | -21.0 | -18.5 | ||||||
| EBIT Margin (Na Porici) | % | ... | ... | ... | ... | ... | ... | -23.5 |
| pruhonice | Unit | 2015 | 2016 | 2017 | 2018 | 2019 | 2020 | 2021 | 2022 | 2023 | 2024 | 2025 | 2026 | 2027 |
| Sales (Pruhonice) | CZK mil | ... | ... | ... | ... | 24.5 | 12.9 | 15.0 | ||||||
| COGS (Pruhonice) | CZK mil | ... | ... | ... | ... | 6.32 | 4.60 | 7.50 | ||||||
| Cost of Rent (Pruhonice) | CZK mil | ... | ... | ... | ... | 7.39 | 6.97 | 4.00 | ||||||
| Personal Cost (Pruhonice) | CZK mil | ... | ... | ... | ... | 9.25 | 2.26 | 6.00 | ||||||
| Other Cost (Pruhonice) | CZK mil | ... | ... | ... | ... | 3.63 | 2.86 | 0 | ||||||
| EBITDA (Pruhonice) | CZK mil | ... | ... | ... | ... | -2.04 | -3.83 | -2.50 | ||||||
| Food Cost as % of Sales (Pruhonice) | % | ... | ... | ... | ... | 25.7 | 35.8 | 50.0 | ||||||
| Rent Cost as % of Sales (Pruhonice) | % | ... | ... | ... | ... | 30.1 | 54.2 | 26.7 | ||||||
| Personal Cost as % of Sales (Pruhonice) | % | ... | ... | ... | ... | 37.7 | 17.5 | 40.0 | ||||||
| EBITDA Margin (Pruhonice) | % | ... | ... | ... | ... | -8.32 | -29.8 | -16.7 | ||||||
| EBIT Margin (Pruhonice) | % | ... | ... | ... | ... | ... | ... | -20.0 | ||||||
| Net Margin (Pruhonice) | % | ... | ... | ... | ... | ... | ... | -20.0 |
| andel | Unit | 2015 | 2016 | 2017 | 2018 | 2019 | 2020 | 2021 | 2022 | 2023 | 2024 | 2025 | 2026 | 2027 |
| Sales (Andel) | CZK mil | ... | ... | ... | ... | 31.5 | 14.7 | 15.8 | ||||||
| COGS (Andel) | CZK mil | ... | ... | ... | ... | 8.16 | 5.09 | 6.01 | ||||||
| Cost of Rent (Andel) | CZK mil | ... | ... | ... | ... | 4.52 | 3.74 | 3.50 | ||||||
| Personal Cost (Andel) | CZK mil | ... | ... | ... | ... | 9.71 | 2.83 | 7.15 | ||||||
| Other Cost (Andel) | CZK mil | ... | ... | ... | ... | 1.74 | 1.66 | -0.549 | ||||||
| EBITDA (Andel) | CZK mil | ... | ... | ... | ... | 7.39 | 1.39 | -0.284 | ||||||
| Food Cost as % of Sales (Andel) | % | ... | ... | ... | ... | 25.9 | 34.6 | 38.0 | ||||||
| Rent Cost as % of Sales (Andel) | % | ... | ... | ... | ... | 14.3 | 25.4 | 22.1 | ||||||
| Personal Cost as % of Sales (Andel) | % | ... | ... | ... | ... | 30.8 | 19.2 | 45.2 | ||||||
| EBITDA Margin (Andel) | % | ... | ... | ... | ... | 23.5 | 9.44 | -1.80 | ||||||
| EBIT Margin (Andel) | % | ... | ... | ... | ... | ... | ... | -2.73 | ||||||
| Net Margin (Andel) | % | ... | ... | ... | ... | ... | ... | -2.58 |
| legerova | Unit | 2015 | 2016 | 2017 | 2018 | 2019 | 2020 | 2021 | 2022 | 2023 | 2024 | 2025 | 2026 | 2027 |
| Sales (Legerova) | CZK mil | ... | ... | ... | ... | 23.2 | 7.17 | 0 | ||||||
| COGS (Legerova) | CZK mil | ... | ... | ... | ... | 6.04 | 2.37 | 0 | ||||||
| Cost of Rent (Legerova) | CZK mil | ... | ... | ... | ... | 3.71 | 3.50 | 0 | ||||||
| Personal Cost (Legerova) | CZK mil | ... | ... | ... | ... | 7.70 | 1.96 | 0 | ||||||
| Other Cost (Legerova) | CZK mil | ... | ... | ... | ... | 1.43 | 0.707 | 0 | ||||||
| EBITDA (Legerova) | CZK mil | ... | ... | ... | ... | 4.28 | -1.37 | 0 | ||||||
| Food Cost as % of Sales (Legerova) | % | ... | ... | ... | ... | 26.1 | 33.0 | ... | ... | ... | ... | ... | ... | ... |
| Rent Cost as % of Sales (Legerova) | % | ... | ... | ... | ... | 16.0 | 48.9 | ... | ... | ... | ... | ... | ... | ... |
| Personal Cost as % of Sales (Legerova) | % | ... | ... | ... | ... | 33.2 | 27.4 | ... | ... | ... | ... | ... | ... | ... |
| EBITDA Margin (Legerova) | % | ... | ... | ... | ... | 18.5 | -19.2 | ... | ... | ... | ... | ... | ... | ... |
| vysocanska | Unit | 2015 | 2016 | 2017 | 2018 | 2019 | 2020 | 2021 | 2022 | 2023 | 2024 | 2025 | 2026 | 2027 |
| Sales (Vysocanska) | CZK mil | ... | ... | ... | ... | 13.3 | 8.70 | 8.74 | ||||||
| COGS (Vysocanska) | CZK mil | ... | ... | ... | ... | 4.24 | 2.98 | 4.50 | ||||||
| Cost of Rent (Vysocanska) | CZK mil | ... | ... | ... | ... | 2.45 | 2.43 | 1.55 | ||||||
| Personal Cost (Vysocanska) | CZK mil | ... | ... | ... | ... | 3.24 | 1.41 | 3.71 | ||||||
| Other Cost (Vysocanska) | CZK mil | ... | ... | ... | ... | 3.81 | 1.56 | 0.357 | ||||||
| EBITDA (Vysocanska) | CZK mil | ... | ... | ... | ... | -0.473 | 0.306 | -1.37 | ||||||
| Food Cost as % of Sales (Vysocanska) | % | ... | ... | ... | ... | 32.0 | 34.3 | 51.5 | ||||||
| Rent Cost as % of Sales (Vysocanska) | % | ... | ... | ... | ... | 18.4 | 27.9 | 17.7 | ||||||
| Personal Cost as % of Sales (Vysocanska) | % | ... | ... | ... | ... | 24.4 | 16.3 | 42.4 | ||||||
| EBITDA Margin (Vysocanska) | % | ... | ... | ... | ... | -3.57 | 3.52 | -15.7 | ||||||
| EBIT Margin (Vysocanska) | % | ... | ... | ... | ... | ... | ... | -16.4 | ||||||
| Net Margin (Vysocanska) | % | ... | ... | ... | ... | ... | ... | -16.6 |
| ceske budejovice | Unit | 2015 | 2016 | 2017 | 2018 | 2019 | 2020 | 2021 | 2022 | 2023 | 2024 | 2025 | 2026 | 2027 |
| Sales (Ceske Budejovice) | CZK mil | ... | ... | ... | ... | 10.0 | 8.32 | 7.37 | ||||||
| COGS (Ceske Budejovice) | CZK mil | ... | ... | ... | ... | 3.81 | 3.05 | 3.53 | ||||||
| Cost of Rent (Ceske Budejovice) | CZK mil | ... | ... | ... | ... | 2.41 | 2.39 | 1.54 | ||||||
| Personal Cost (Ceske Budejovice) | CZK mil | ... | ... | ... | ... | 5.18 | 2.34 | 2.36 | ||||||
| Other Cost (Ceske Budejovice) | CZK mil | ... | ... | ... | ... | 1.15 | 0.499 | -0.034 | ||||||
| EBITDA (Ceske Budejovice) | CZK mil | ... | ... | ... | ... | -2.50 | 0.034 | -0.028 | ||||||
| Food Cost as % of Sales (Ceske Budejovice) | % | ... | ... | ... | ... | 37.9 | 36.7 | 47.9 | ||||||
| Rent Cost as % of Sales (Ceske Budejovice) | % | ... | ... | ... | ... | 24.0 | 28.7 | 20.9 | ||||||
| Personal Cost as % of Sales (Ceske Budejovice) | % | ... | ... | ... | ... | 51.5 | 28.2 | 32.0 | ||||||
| EBITDA Margin (Ceske Budejovice) | % | ... | ... | ... | ... | -24.9 | 0.409 | -0.380 | ||||||
| EBIT Margin (Ceske Budejovice) | % | ... | ... | ... | ... | ... | ... | -0.977 | ||||||
| Net Margin (Ceske Budejovice) | % | ... | ... | ... | ... | ... | ... | -1.98 |
| pivovar narodni | Unit | 2015 | 2016 | 2017 | 2018 | 2019 | 2020 | 2021 | 2022 | 2023 | 2024 | 2025 | 2026 | 2027 |
| Sales (Pivovar Narodni) | CZK mil | ... | ... | ... | ... | 37.9 | 10.5 | 11.5 | ||||||
| COGS (Pivovar Narodni) | CZK mil | ... | ... | ... | ... | 9.06 | 3.29 | 4.42 | ||||||
| Cost of Rent (Pivovar Narodni) | CZK mil | ... | ... | ... | ... | 3.50 | 3.11 | 3.50 | ||||||
| Personal Cost (Pivovar Narodni) | CZK mil | ... | ... | ... | ... | 14.2 | 4.51 | 8.47 | ||||||
| Other Cost (Pivovar Narodni) | CZK mil | ... | ... | ... | ... | 3.41 | 1.84 | -0.891 | ||||||
| EBITDA (Pivovar Narodni) | CZK mil | ... | ... | ... | ... | 7.81 | -2.25 | -4.02 | ||||||
| Food Cost as % of Sales (Pivovar Narodni) | % | ... | ... | ... | ... | 23.9 | 31.4 | 38.5 | ||||||
| Rent Cost as % of Sales (Pivovar Narodni) | % | ... | ... | ... | ... | 9.22 | 29.6 | 30.5 | ||||||
| Personal Cost as % of Sales (Pivovar Narodni) | % | ... | ... | ... | ... | 37.4 | 42.9 | 73.8 | ||||||
| EBITDA Margin (Pivovar Narodni) | % | ... | ... | ... | ... | 20.6 | -21.4 | -35.1 | ||||||
| EBIT Margin (Pivovar Narodni) | % | ... | ... | ... | ... | ... | ... | -37.3 | ||||||
| Net Margin (Pivovar Narodni) | % | ... | ... | ... | ... | ... | ... | -40.6 |
| obcanska plovarna | Unit | 2015 | 2016 | 2017 | 2018 | 2019 | 2020 | 2021 | 2022 | 2023 | 2024 | 2025 | 2026 | 2027 |
| Sales (Obcanska Plovarna) | CZK mil | ... | ... | ... | ... | 22.5 | 9.93 | 14.5 | ||||||
| COGS (Obcanska Plovarna) | CZK mil | ... | ... | ... | ... | 6.12 | 3.32 | 5.98 | ||||||
| Cost of Rent (Obcanska Plovarna) | CZK mil | ... | ... | ... | ... | 2.58 | 2.76 | 2.90 | ||||||
| Personal Cost (Obcanska Plovarna) | CZK mil | ... | ... | ... | ... | 3.54 | 1.65 | 5.99 | ||||||
| Other Cost (Obcanska Plovarna) | CZK mil | ... | ... | ... | ... | 6.80 | 1.69 | 2.16 | ||||||
| EBITDA (Obcanska Plovarna) | CZK mil | ... | ... | ... | ... | 3.44 | 0.525 | -2.54 | ||||||
| Food Cost as % of Sales (Obcanska Plovarna) | % | ... | ... | ... | ... | 27.2 | 33.4 | 41.3 | ||||||
| Rent Cost as % of Sales (Obcanska Plovarna) | % | ... | ... | ... | ... | 11.5 | 27.8 | 20.0 | ||||||
| Personal Cost as % of Sales (Obcanska Plovarna) | % | ... | ... | ... | ... | 15.7 | 16.6 | 41.3 | ||||||
| EBITDA Margin (Obcanska Plovarna) | % | ... | ... | ... | ... | 15.3 | 5.29 | -17.5 | ||||||
| EBIT Margin (Obcanska Plovarna) | % | ... | ... | ... | ... | 3.93 | -20.4 | -35.1 | ||||||
| Net Margin (Obcanska Plovarna) | % | ... | ... | ... | ... | ... | ... | -58.5 |
| arena liberec | Unit | 2015 | 2016 | 2017 | 2018 | 2019 | 2020 | 2021 | 2022 | 2023 | 2024 | 2025 | 2026 | 2027 |
| Sales (Arena Liberec) | CZK mil | ... | ... | ... | ... | 45.8 | 15.8 | 18.6 | ||||||
| COGS (Arena Liberec) | CZK mil | ... | ... | ... | ... | 17.8 | 6.78 | 8.17 | ||||||
| Cost of Rent (Arena Liberec) | CZK mil | ... | ... | ... | ... | 8.53 | 4.34 | 5.48 | ||||||
| Personal Cost (Arena Liberec) | CZK mil | ... | ... | ... | ... | 8.91 | 6.00 | 7.82 | ||||||
| Other Cost (Arena Liberec) | CZK mil | ... | ... | ... | ... | 3.82 | 0.639 | 14.9 | ||||||
| EBITDA (Arena Liberec) | CZK mil | ... | ... | ... | ... | 6.70 | -1.98 | -17.8 | ||||||
| Food Cost as % of Sales (Arena Liberec) | % | ... | ... | ... | ... | 38.9 | 43.0 | 44.0 | ||||||
| Rent Cost as % of Sales (Arena Liberec) | % | ... | ... | ... | ... | 18.6 | 27.5 | 29.5 | ||||||
| Personal Cost as % of Sales (Arena Liberec) | % | ... | ... | ... | ... | 19.5 | 38.0 | 42.1 | ||||||
| EBITDA Margin (Arena Liberec) | % | ... | ... | ... | ... | 14.6 | -12.5 | -95.9 | ||||||
| EBIT Margin (Arena Liberec) | % | ... | ... | ... | ... | 14.0 | -14.5 | -97.6 | ||||||
| Net Margin (Arena Liberec) | % | ... | ... | ... | ... | ... | ... | -97.2 |
| arena pardubice | Unit | 2015 | 2016 | 2017 | 2018 | 2019 | 2020 | 2021 | 2022 | 2023 | 2024 | 2025 | 2026 | 2027 |
| Sales (Arena Pardubice) | CZK mil | ... | ... | ... | ... | 13.0 | 5.41 | 9.72 | ||||||
| COGS (Arena Pardubice) | CZK mil | ... | ... | ... | ... | 4.80 | 2.06 | 4.08 | ||||||
| Cost of Rent (Arena Pardubice) | CZK mil | ... | ... | ... | ... | 2.39 | 1.63 | 1.50 | ||||||
| Personal Cost (Arena Pardubice) | CZK mil | ... | ... | ... | ... | 4.14 | 3.49 | 4.13 | ||||||
| Other Cost (Arena Pardubice) | CZK mil | ... | ... | ... | ... | 0.303 | 0.325 | 0.641 | ||||||
| EBITDA (Arena Pardubice) | CZK mil | ... | ... | ... | ... | 1.33 | -2.09 | -0.627 | ||||||
| Food Cost as % of Sales (Arena Pardubice) | % | ... | ... | ... | ... | 37.1 | 38.1 | 42.0 | ||||||
| Rent Cost as % of Sales (Arena Pardubice) | % | ... | ... | ... | ... | 18.4 | 30.0 | 15.4 | ||||||
| Personal Cost as % of Sales (Arena Pardubice) | % | ... | ... | ... | ... | 32.0 | 64.5 | 42.5 | ||||||
| EBITDA Margin (Arena Pardubice) | % | ... | ... | ... | ... | 10.2 | -38.7 | -6.45 | ||||||
| EBIT Margin (Arena Pardubice) | % | ... | ... | ... | ... | 6.91 | -46.6 | -10.9 | ||||||
| Net Margin (Arena Pardubice) | % | ... | ... | ... | ... | ... | ... | -10.6 |
| arena kladno | Unit | 2015 | 2016 | 2017 | 2018 | 2019 | 2020 | 2021 | 2022 | 2023 | 2024 | 2025 | 2026 | 2027 |
| Sales (Arena Kladno) | CZK mil | ... | ... | ... | ... | 3.53 | 2.73 | 0.905 | ||||||
| COGS (Arena Kladno) | CZK mil | ... | ... | ... | ... | 2.46 | 1.12 | 0.870 | ||||||
| Cost of Rent (Arena Kladno) | CZK mil | ... | ... | ... | ... | 0.457 | 0.365 | 0.250 | ||||||
| Personal Cost (Arena Kladno) | CZK mil | ... | ... | ... | ... | 0.790 | 1.41 | 0.919 | ||||||
| Other Cost (Arena Kladno) | CZK mil | ... | ... | ... | ... | 0.785 | 0.607 | -0.426 | ||||||
| EBITDA (Arena Kladno) | CZK mil | ... | ... | ... | ... | -0.964 | -0.763 | -0.708 | ||||||
| Food Cost as % of Sales (Arena Kladno) | % | ... | ... | ... | ... | 69.8 | 40.9 | 96.1 | ... | |||||
| Rent Cost as % of Sales (Arena Kladno) | % | ... | ... | ... | ... | 12.9 | 13.4 | 27.6 | ... | |||||
| Personal Cost as % of Sales (Arena Kladno) | % | ... | ... | ... | ... | 22.4 | 51.4 | 102 | ... | |||||
| EBITDA Margin (Arena Kladno) | % | ... | ... | ... | ... | -27.3 | -27.9 | -78.2 | ... | |||||
| EBIT Margin (Arena Kladno) | % | ... | ... | ... | ... | -27.9 | -28.7 | -80.7 | ... | |||||
| Net Margin (Arena Kladno) | % | ... | ... | ... | ... | ... | ... | -85.2 | ... |
| catering | Unit | 2015 | 2016 | 2017 | 2018 | 2019 | 2020 | 2021 | 2022 | 2023 | 2024 | 2025 | 2026 | 2027 |
| Sales (Catering) | CZK mil | ... | ... | ... | ... | 19.8 | 5.59 | 0 | ||||||
| COGS (Catering) | CZK mil | ... | ... | ... | ... | 7.21 | 2.52 | 0 | ||||||
| Cost of Rent (Catering) | CZK mil | ... | ... | ... | ... | 1.82 | 0.203 | 0 | ||||||
| Personal Cost (Catering) | CZK mil | ... | ... | ... | ... | 4.45 | 1.80 | 0 | ||||||
| Other Cost (Catering) | CZK mil | ... | ... | ... | ... | 3.66 | 1.86 | 1.00 | ||||||
| EBITDA (Catering) | CZK mil | ... | ... | ... | ... | 2.66 | -0.788 | -1.00 | ||||||
| Food Cost as % of Sales (Catering) | % | ... | ... | ... | ... | 36.4 | 45.0 | ... | ||||||
| Rent Cost as % of Sales (Catering) | % | ... | ... | ... | ... | 9.18 | 3.63 | ... | ||||||
| Personal Cost as % of Sales (Catering) | % | ... | ... | ... | ... | 22.5 | 32.1 | ... | ||||||
| EBITDA Margin (Catering) | % | ... | ... | ... | ... | 13.4 | -14.1 | ... |
| spalicek | Unit | 2015 | 2016 | 2017 | 2018 | 2019 | 2020 | 2021 | 2022 | 2023 | 2024 | 2025 | 2026 | 2027 |
| Sales (Spalicek) | CZK mil | ... | ... | ... | ... | 0 | 0 | 0 | ||||||
| COGS (Spalicek) | CZK mil | ... | ... | ... | ... | 0 | 0 | 0 | ||||||
| Cost of Rent (Spalicek) | CZK mil | ... | ... | ... | ... | 0 | 0 | 0 | ||||||
| Personal Cost (Spalicek) | CZK mil | ... | ... | ... | ... | 0 | 0 | 0 | ||||||
| Other Cost (Spalicek) | CZK mil | ... | ... | ... | ... | 0 | 0 | 0 | ||||||
| EBITDA (Spalicek) | CZK mil | ... | ... | ... | ... | 0 | 0 | 0 | ||||||
| Food Cost as % of Sales (Spalicek) | % | ... | ... | ... | ... | ... | ... | ... | ||||||
| Rent Cost as % of Sales (Spalicek) | % | ... | ... | ... | ... | ... | ... | ... | ||||||
| Personal Cost as % of Sales (Spalicek) | % | ... | ... | ... | ... | ... | ... | ... | ||||||
| EBITDA Margin (Spalicek) | % | ... | ... | ... | ... | ... | ... | ... | ||||||
| EBIT Margin (Spalicek) | % | ... | ... | ... | ... | ... | ... | ... |
| arkady pankrac | Unit | 2015 | 2016 | 2017 | 2018 | 2019 | 2020 | 2021 | 2022 | 2023 | 2024 | 2025 | 2026 | 2027 |
| Sales (Arkady Pankrac) | CZK mil | ... | ... | ... | ... | 0 | 0 | 0 | ||||||
| COGS (Arkady Pankrac) | CZK mil | ... | ... | ... | ... | 0 | 0 | 0 | ||||||
| Cost of Rent (Arkady Pankrac) | CZK mil | ... | ... | ... | ... | 0 | 0 | 0 | ||||||
| Personal Cost (Arkady Pankrac) | CZK mil | ... | ... | ... | ... | 0 | 0 | 0 | ||||||
| Other Cost (Arkady Pankrac) | CZK mil | ... | ... | ... | ... | 0 | 0 | 0 | ||||||
| EBITDA (Arkady Pankrac) | CZK mil | ... | ... | ... | ... | 0 | 0 | 0 | ||||||
| Food Cost as % of Sales (Arkady Pankrac) | % | ... | ... | ... | ... | ... | ... | ... | ||||||
| Rent Cost as % of Sales (Arkady Pankrac) | % | ... | ... | ... | ... | ... | ... | ... | ||||||
| Personal Cost as % of Sales (Arkady Pankrac) | % | ... | ... | ... | ... | ... | ... | ... | ||||||
| EBITDA Margin (Arkady Pankrac) | % | ... | ... | ... | ... | ... | ... | ... | ||||||
| EBIT Margin (Arkady Pankrac) | % | ... | ... | ... | ... | ... | ... | ... |
| vaclavka | Unit | 2015 | 2016 | 2017 | 2018 | 2019 | 2020 | 2021 | 2022 | 2023 | 2024 | 2025 | 2026 | 2027 |
| Sales (Vaclavka) | CZK mil | ... | ... | ... | ... | 0 | 0 | 0 | ||||||
| COGS (Vaclavka) | CZK mil | ... | ... | ... | ... | 0 | 0 | 0 | ||||||
| Cost of Rent (Vaclavka) | CZK mil | ... | ... | ... | ... | 0 | 0 | 0 | ||||||
| Personal Cost (Vaclavka) | CZK mil | ... | ... | ... | ... | 0 | 0 | 0 | ||||||
| Other Cost (Vaclavka) | CZK mil | ... | ... | ... | ... | 0 | 0 | 0 | ||||||
| EBITDA (Vaclavka) | CZK mil | ... | ... | ... | ... | 0 | 0 | 0 | ||||||
| Food Cost as % of Sales (Vaclavka) | % | ... | ... | ... | ... | ... | ... | ... | ||||||
| Rent Cost as % of Sales (Vaclavka) | % | ... | ... | ... | ... | ... | ... | ... | ||||||
| Personal Cost as % of Sales (Vaclavka) | % | ... | ... | ... | ... | ... | ... | ... | ||||||
| EBITDA Margin (Vaclavka) | % | ... | ... | ... | ... | ... | ... | ... | ||||||
| EBIT Margin (Vaclavka) | % | ... | ... | ... | ... | ... | ... | ... |
| no stress | Unit | 2015 | 2016 | 2017 | 2018 | 2019 | 2020 | 2021 | 2022 | 2023 | 2024 | 2025 | 2026 | 2027 |
| Sales (No Stress) | CZK mil | ... | ... | ... | ... | 0 | 0 | 0 | ||||||
| COGS (No Stress) | CZK mil | ... | ... | ... | ... | 0 | 0 | 0 | ||||||
| Cost of Rent (No Stress) | CZK mil | ... | ... | ... | ... | 0 | 0 | 0 | ||||||
| Personal Cost (No Stress) | CZK mil | ... | ... | ... | ... | 0 | 0 | 0 | ||||||
| Other Cost (No Stress) | CZK mil | ... | ... | ... | ... | 0 | 0 | 0 | ||||||
| EBITDA (No Stress) | CZK mil | ... | ... | ... | ... | 0 | 0 | 0 | ||||||
| Food Cost as % of Sales (No Stress) | % | ... | ... | ... | ... | ... | ... | ... | ||||||
| Rent Cost as % of Sales (No Stress) | % | ... | ... | ... | ... | ... | ... | ... | ||||||
| Personal Cost as % of Sales (No Stress) | % | ... | ... | ... | ... | ... | ... | ... | ||||||
| EBITDA Margin (No Stress) | % | ... | ... | ... | ... | ... | ... | ... | ||||||
| EBIT Margin (No Stress) | % | ... | ... | ... | ... | ... | ... | ... | ||||||
| Net Margin (No Stress) | % | ... | ... | ... | ... | ... | ... | ... |
| nove restaurace pizza coloseum | Unit | 2015 | 2016 | 2017 | 2018 | 2019 | 2020 | 2021 | 2022 | 2023 | 2024 | 2025 | 2026 | 2027 |
| Sales (New Restaurants Coloseum) | CZK mil | ... | ... | ... | ... | 0 | 0 | 0 | ||||||
| COGS (New Restaurants Coloseum) | CZK mil | ... | ... | ... | ... | ... | ... | ... | ||||||
| Cost of Rent (New Restaurants Coloseum) | CZK mil | ... | ... | ... | ... | ... | ... | ... | ||||||
| Personal Cost (New Restaurants Coloseum) | CZK mil | ... | ... | ... | ... | ... | ... | ... | ||||||
| Other Cost (New Restaurants Coloseum) | CZK mil | ... | ... | ... | ... | ... | ... | ... | ||||||
| EBITDA (New Restaurants Coloseum) | CZK mil | ... | ... | ... | ... | ... | ... | ... | ||||||
| Food Cost as % of Sales (New Restaurants Coloseum) | % | ... | ... | ... | ... | ... | ... | ... | ... | |||||
| Rent Cost as % of Sales (New Restaurants Coloseum) | % | ... | ... | ... | ... | ... | ... | ... | ... | |||||
| Personal Cost as % of Sales (New Restaurants Coloseum) | % | ... | ... | ... | ... | ... | ... | ... | ... | |||||
| EBITDA Margin (New Restaurants Coloseum) | % | ... | ... | ... | ... | ... | ... | ... | ... |
| caffe pascucci | Unit | 2015 | 2016 | 2017 | 2018 | 2019 | 2020 | 2021 | 2022 | 2023 | 2024 | 2025 | 2026 | 2027 |
| Sales (Caffe Pascucci) | CZK mil | ... | ... | ... | ... | ... | ... | ... | ||||||
| COGS (Caffe Pascucci) | CZK mil | ... | ... | ... | ... | ... | ... | ... | ||||||
| Cost of Rent (Caffe Pascucci) | CZK mil | ... | ... | ... | ... | ... | ... | ... | ||||||
| Personal Cost (Caffe Pascucci) | CZK mil | ... | ... | ... | ... | ... | ... | ... | ||||||
| Other Cost (Caffe Pascucci) | CZK mil | ... | ... | ... | ... | ... | ... | ... | ||||||
| EBITDA (Caffe Pascucci) | CZK mil | ... | ... | ... | ... | ... | ... | ... | ||||||
| Food Cost as % of Sales (Caffe Pascucci) | % | ... | ... | ... | ... | ... | ... | ... | ||||||
| Rent Cost as % of Sales (Caffe Pascucci) | % | ... | ... | ... | ... | ... | ... | ... | ||||||
| Personal Cost as % of Sales (Caffe Pascucci) | % | ... | ... | ... | ... | ... | ... | ... | ||||||
| EBITDA Margin (Caffe Pascucci) | % | ... | ... | ... | ... | ... | ... | ... |
| pragogastro | Unit | 2015 | 2016 | 2017 | 2018 | 2019 | 2020 | 2021 | 2022 | 2023 | 2024 | 2025 | 2026 | 2027 |
| Sales (Pragogastro) | CZK mil | ... | ... | ... | ... | 39.3 | 12.2 | 6.26 | ||||||
| Internal Sales (Pragogastro) | '000 | ... | ... | ... | ... | 112 | 43.4 | 25.0 | ||||||
| External Sales (Pragogastro) | CZK | ... | ... | ... | ... | 39.3 | 12.2 | 6.26 | ||||||
| COGS (Pragogastro) | CZK mil | ... | ... | ... | ... | 34.0 | 9.93 | 4.92 | ||||||
| Cost of Rent (Pragogastro) | CZK mil | ... | ... | ... | ... | 0.936 | 0.679 | 0.400 | ||||||
| Personal Cost (Pragogastro) | CZK mil | ... | ... | ... | ... | 7.65 | 3.70 | 2.95 | ||||||
| Other Cost (Pragogastro) | CZK mil | ... | ... | ... | ... | 9.34 | 9.06 | 2.82 | ||||||
| EBITDA (Pragogastro) | CZK mil | ... | ... | ... | ... | 3.60 | -1.02 | 1.82 | ||||||
| Food Cost as % of Sales (Pragogastro) | % | ... | ... | ... | ... | 86.6 | 81.4 | 78.6 | ||||||
| Rent Cost as % of Sales (Pragogastro) | % | ... | ... | ... | ... | 2.38 | 5.57 | 6.39 | ||||||
| Personal Cost as % of Sales (Pragogastro) | % | ... | ... | ... | ... | 19.5 | 30.3 | 47.1 | ||||||
| EBITDA Margin (Pragogastro) | % | ... | ... | ... | ... | 9.16 | -8.38 | 29.0 | ||||||
| EBIT Margin (Pragogastro) | % | ... | ... | ... | ... | 7.69 | -17.6 | 26.1 | ||||||
| Net Margin (Pragogastro) | % | ... | ... | ... | ... | 11.3 | -13.2 | 26.8 |
Get all company financials in excel:


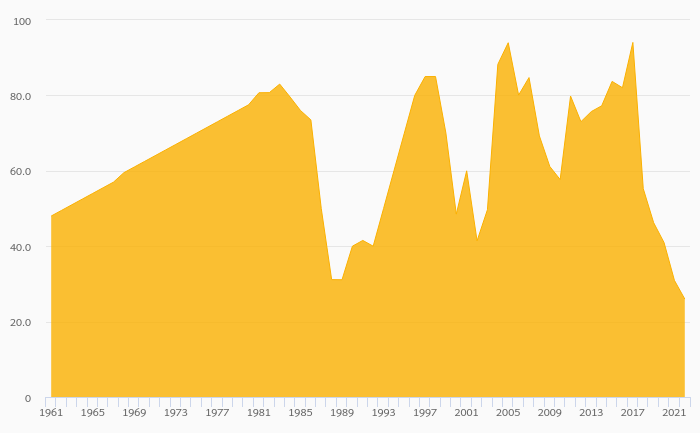
By Helgi Library - May 1, 2022
Coloseum Restaurants invested a total of CZK -57.8 mil in 2021, down 165% compared to the previous year. Historically, between 2016 - 2021, the company's investments stood at a high of CZK 93.4 mil in 2018 and a low of CZK -57.8 mil in 2021....
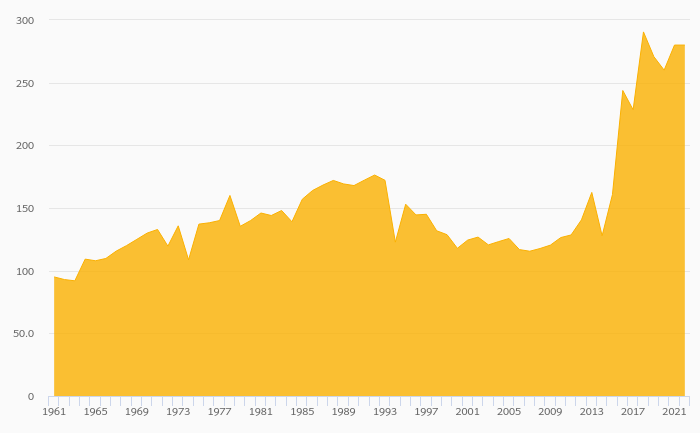
By Helgi Library - May 1, 2022
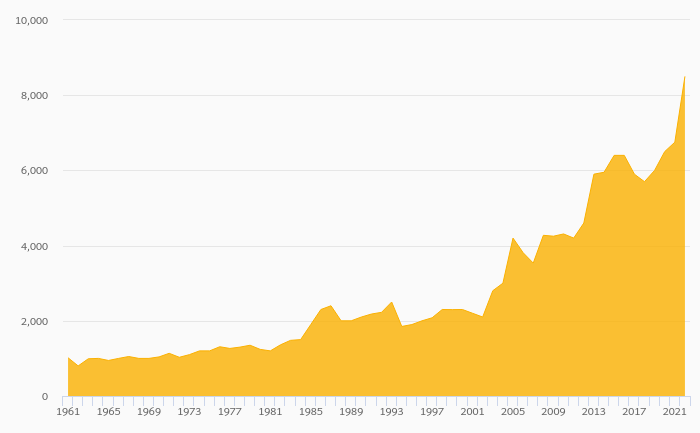
Coloseum Restaurants's net debt stood at CZK 171 mil and accounted for 1,213% of equity at the end of 2021. The ratio is up 984 pp compared to the previous year. Historically, the firm’s net debt to equity reached a high of 1,213% in 2021 and a l...

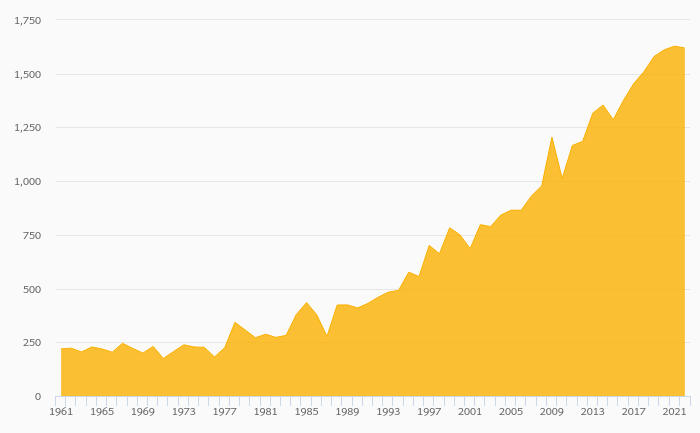
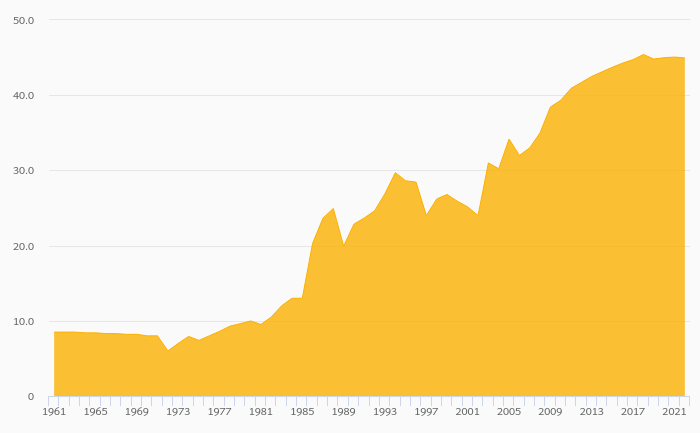
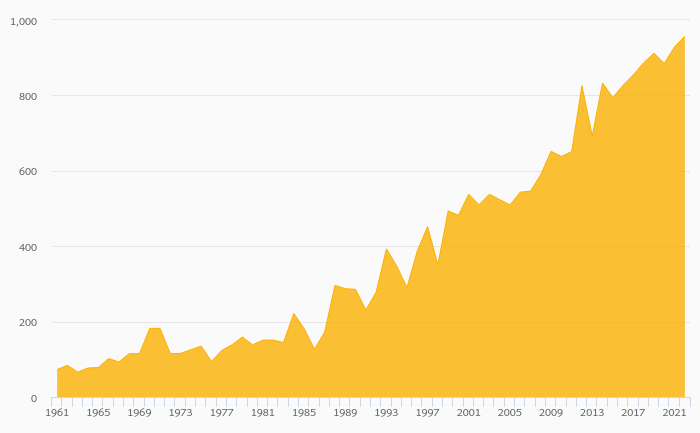
Coloseum Restaurants has been growing its sales by 28.9% a year on average in the last 5 years. EBITDA has grown by 7% during that time to total of CZK 125 mil in 2027, or 12.5% of sales. That’s compared to 10.7% average margin seen in last five years.
The company netted CZK 69.0 mil in 2027 implying ROE of 60.8% and ROCE of 23.2%. Again, the average figures were 70.7% and 13.6%, respectively when looking at the previous 5 years.
Coloseum Restaurants’s net debt amounted to CZK 128 mil at the end of 2027, or 96.2% of equity. When compared to EBITDA, net debt was 1.03x, down when compared to average of 2.96x seen in the last 5 years.
 Helgi Library