
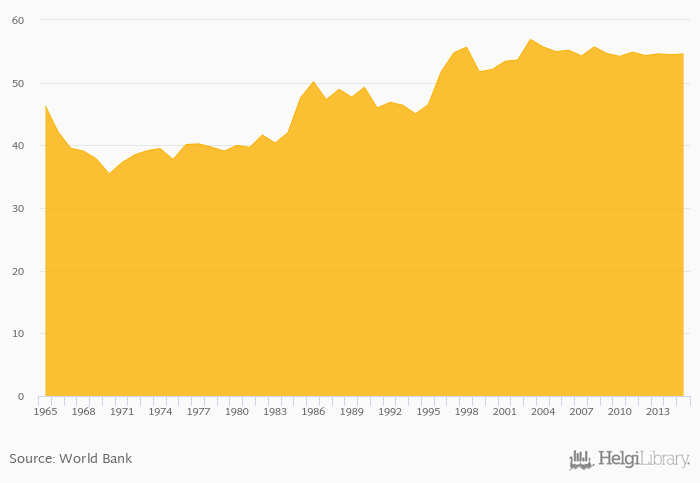
Value added of agriculture as a share of GDP rose 0.241% to 54.6% in Central African Republic in 2015, according to Faostat.
Historically, value added of agriculture as a share of GDP in Central African Republic reached an all time high of 56.9% in 2003 and an all time low of 35.5% in 1970. When compared to Central African Republic's main peers, value added of agriculture as a share of GDP in Cameroon amounted to 23.2%, 53.5% in Chad, 27.4% in Sudan and 21.5% in Dem. Republic of the Congo in 2015.
Central African Republic has been ranked 2nd within the group of 153 countries we follow in terms of value added of agriculture as a share of GDP.
| Agriculture, Value Added (As % of GDP) | Unit | 1995 | 1996 | 1997 | 1998 | 1999 | 2000 | 2001 | 2002 | 2003 | 2004 | 2005 | 2006 | 2007 | 2008 | 2009 | 2010 | 2011 | 2012 | 2013 | 2014 | 2015 |
| Angola | % | 10.2% | 9.84% | 9.29% | 7.19% | 10.1% | ||||||||||||||||
| Cameroon | % | 23.5% | 23.4% | 23.6% | 23.2% | 22.9% | ||||||||||||||||
| Central African Republic | % | 54.6% | 54.2% | 54.9% | 54.3% | 54.6% | ||||||||||||||||
| Chad | % | 47.9% | 53.4% | 53.1% | 55.8% | 51.5% | ||||||||||||||||
| Congo | % | 4.51% | 3.83% | 3.38% | 3.93% | 4.36% | ||||||||||||||||
| Dem. Republic of the Congo | % | 25.2% | 22.4% | 22.0% | 21.8% | 20.8% | ||||||||||||||||
| Egypt | % | 13.6% | 14.0% | 14.5% | 14.5% | 14.5% | ||||||||||||||||
| Ethiopia | % | 48.6% | 44.7% | 44.7% | 48.0% | 45.0% | ||||||||||||||||
| Gabon | % | 5.36% | 4.06% | 3.80% | 4.02% | 3.91% | ||||||||||||||||
| Niger | % | 39.2% | 40.9% | 38.3% | 39.4% | 37.2% | ||||||||||||||||
| Nigeria | % | 37.1% | 23.9% | 22.3% | 22.1% | 21.0% | ||||||||||||||||
| South Sudan | % | ... | ... | ... | ... | ... | ... | ... | ... | ... | ... | ... | ... | ... | ... | ... | ... | ... | ... | ... | ... | ... |
| Sudan | % | 26.3% | 24.6% | 25.4% | 28.7% | 28.1% | ||||||||||||||||
| Zambia | % | 12.4% | 10.5% | 10.2% | 10.3% | 9.64% |
 Helgi Library


