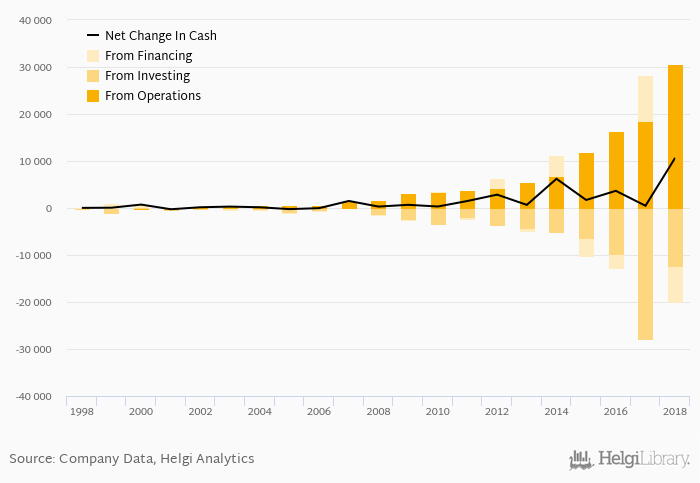
Amazon.com Inc's operating cash flow stood at USD 30,723 mil in 2018, up 66.7% when compared to the previous year. Historically, between 1998 - 2018, the firm’s operating cash flow reached a high of USD 30,723 mil in 2018 and a low of USD -130 mil in 2000.
Amazon.com Inc's total investments stood at USD -12,369 mil and accounted for of sales in 2018. This is compared to an average of
Severity: Warning
Message: Division by zero
Filename: models/Chunks_model.php
Line Number: 420
Cash from financing amounted to USD -7,686 mil, so the company generated USD 10,668 mil net cash in 2018.
At the end of 2018, the company had a net debt of USD -8,255 mil, or -0.295x of EBITDA and -0.190 of equity. Net working capital amounted to USD -4,341 mil, or -1.86% of sales. The cash conversion cycle stood at -18.2 days in 2018. This is an improvement compared to the previous year (-22.4 days), so Amazon.com Inc’s working capital was tied up for 4.23 fewer days.
You can see all the company’s data at Amazon.com Inc profile, or you can download a report on the company in the report section.
 Helgi Library