
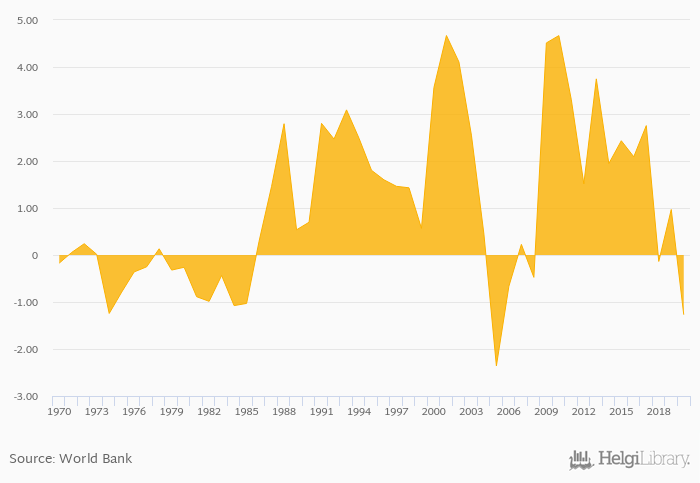
Balance of trade in goods and services fell 231% to NZD -1.27 bil in New Zealand in 2020, according to the National Statistical Office.
Historically, balance of trade in goods and services in New Zealand reached an all time high of NZD 4.67 bil in 2001 and an all time low of NZD -2.36 bil in 2005. When compared to New Zealand's main peers, balance of trade in goods and services in Australia amounted to AUD 74.9 bil, IDR 241,952 bil in Indonesia, MYR 90.3 bil in Malaysia and PHP -1,394 bil in Philippines in 2020.
New Zealand has been ranked 76th within the group of 163 countries we follow in terms of balance of trade in goods and services, 20 places below the position seen 10 years ago.
| Balance of Trade In Goods and Services (Local Currency) | Unit | 2001 | 2002 | 2003 | 2004 | 2005 | 2006 | 2007 | 2008 | 2009 | 2010 | 2011 | 2012 | 2013 | 2014 | 2015 | 2016 | 2017 | 2018 | 2019 | 2020 | 2021 |
| Australia | AUD bil | -24.1 | -37.8 | 8.99 | 6.58 | 48.2 | ||||||||||||||||
| Cambodia | KHR bil | -3,251 | -3,564 | -3,076 | -1,699 | -1,512 | ||||||||||||||||
| China | CNY bil | 2,235 | 1,698 | 1,458 | 605 | 917 | ||||||||||||||||
| Indonesia | IDR bil | 44,113 | 93,837 | 135,778 | -158,599 | -70,411 | ||||||||||||||||
| Malaysia | MYR bil | 88.6 | 83.1 | 94.3 | 97.1 | 114 | ||||||||||||||||
| New Zealand | NZD bil | 2.43 | 2.09 | 2.75 | -0.137 | 0.968 | ||||||||||||||||
| Papua New Guinea | PGK bil | ... | ... | ... | ... | ... | ... | ... | ... | ... | ... | ... | ... | ... | ... | ... | ... | ... | ||||
| Philippines | PHP bil | -659 | -1,276 | -1,501 | -2,144 | -2,357 | ||||||||||||||||
| Singapore | SGD bil | 116 | 115 | 125 | 147 | 147 | ||||||||||||||||
| Taiwan | TWD bil | ... | ... | ... | ... | ... | ... | ... | ... | ... | ... | ... | ... | ... | ... | ... | ... | ... | ... | ... | ... | ... |
| Thailand | THB bil | 1,434 | 1,979 | 1,929 | 1,446 | 1,579 | ||||||||||||||||
| Vietnam | VND bil | 48,356 | 158,189 | 160,177 | 293,187 | 432,448 |
 Helgi Library


